
screen time charts for kids
Stop paying for apps that do the parenting for you when a simple visual system works better for free. Are you paying for digital monitoring apps that only cause more friction? Most parents find that a tangible, visual chart on the fridge actually changes behavior more than a background app ever could. Grab our favorite free layout!

Parenting in a digital world feels like a losing battle. You want your kids to be tech-savvy, but you also want them to touch grass. Most families fall into the trap of high-priced monitoring software that promises to “fix” screen addiction. These apps often lead to power struggles, secret devices, and a lack of trust.
Traditional visual systems offer a bridge between strict control and total chaos. They teach children how to manage their own impulses. This approach shifts the focus from “parent as police officer” to “child as manager.” It is a subtle but massive psychological shift that yields long-term results.
screen time charts for kids
Screen time charts for kids are physical, visual tools used to track, limit, or reward digital device usage. Unlike a hidden app, these charts live in the physical world—usually on a refrigerator or a command center. They serve as a constant, non-verbal reminder of the family’s boundaries and expectations.
The core concept relies on making time visible. Children, especially those under twelve, struggle with abstract concepts like “thirty minutes.” A physical chart provides a concrete representation of that time. It transforms a vague rule into a tangible reality they can see, touch, and measure.
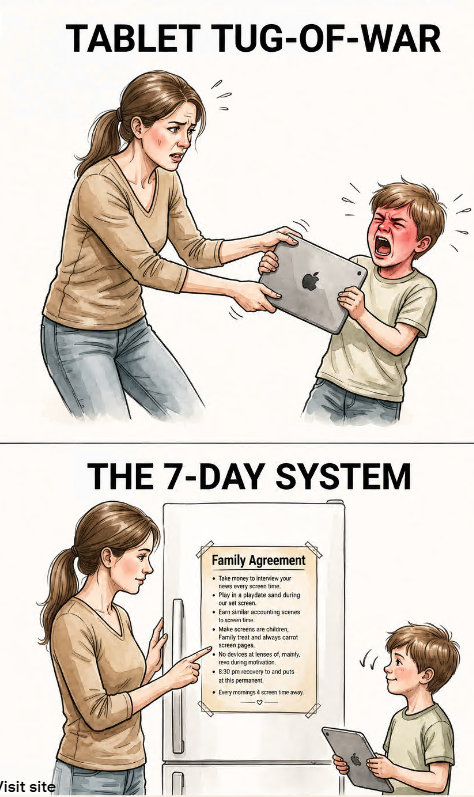
Modern data shows that children aged 8-12 now spend between four and six hours on screens daily. Teens often clock up to nine hours. These numbers are staggering. A visual chart works in real-world situations by forcing a pause. It asks the child to interact with the physical world before diving back into the digital one.
Commonly, these charts are used in “Earn-It” systems. A child must complete a specific list of “non-screen” tasks to unlock their digital time. This might include reading, playing outside, or finishing chores. The chart acts as the referee, removing the emotional weight from the parent’s shoulders.
How to Implement a Screen Time System
Success starts with a plan that the whole family understands. Randomly sticking a piece of paper on the wall rarely works. Follow these steps to build a system that actually sticks.
Step 1: The Design Phase. Sit down with your children and design the layout together. Ask them what they think is a fair amount of time for entertainment. Involving them in the process increases their “buy-in” and reduces later resistance. Ownership is a powerful motivator for compliance.
Step 2: Define the “Daily Minimums.” Establish a list of “Must-Do” activities. These are the non-negotiables that must happen before a device is even touched. Common items include a made bed, thirty minutes of reading, and one helpful chore. Use icons for younger children who cannot read yet.
Step 3: The Token or Checkmark System. Decide how the time will be tracked. Some parents use “screen time tokens” worth fifteen minutes each. Others use a simple dry-erase checkmark system. The goal is to provide immediate, tactile feedback when a task is completed. This builds a positive association with responsibility.
Step 4: Establish the “Off-Ramp.” One of the hardest parts of screen time is the transition away from the device. Use the chart to define what happens when the time is up. This might include a “Five-Minute Warning” checkmark or a specific “Transition Activity” like a quick puzzle or a snack. Clear endings prevent meltdowns.
Step 5: Review and Adjust. Revisit the chart every Sunday evening. Is it working? Are the chores too easy? Is the screen time too high? Adjusting the system keeps it fresh and relevant as your children grow and their interests change.
Benefits of Visual Tracking
Choosing a physical chart over a digital app provides several measurable advantages for child development and family harmony. Visual aids foster self-regulation in ways that background software simply cannot.
Immediate Tactile Satisfaction. Checking off a box or handing in a token provides a dopamine hit. This physical action reinforces the completion of a non-digital task. It bridges the gap between effort and reward, teaching children that “work” comes before “play.”
Reduced Parent-Child Friction. The chart becomes the authority. Instead of saying “No,” a parent can simply point to the chart and say, “What does the list say?” This removes the personal conflict from the situation. The child learns to negotiate with the system rather than arguing with the parent.
Teaches Time Management. Abstract digital timers on a tablet are easy to ignore. A physical chart that tracks “Blocks” of time helps children understand the passage of time. They begin to see that screen time is a finite resource that must be spent wisely.
Zero Financial Cost. Most high-end monitoring apps cost between $50 and $150 per year. A printable chart costs nothing but a piece of paper or a few cents in printer ink. This makes it an accessible solution for every family, regardless of budget.
Challenges and Common Mistakes
Even the best systems can fail if they are poorly managed. Understanding why these mistakes happen allows you to avoid them from the start.
Inconsistency is the Primary Killer. If you enforce the chart on Monday but ignore it on Tuesday because you are tired, the system loses all credibility. Children are experts at finding loopholes. They will quickly learn that “no” doesn’t really mean “no” if you aren’t consistent.
Setting Unrealistic Daily Minimums. If the list of chores is so long that the child never reaches their screen time, they will become discouraged. This leads to resentment and a desire to “cheat” the system. Keep the initial tasks simple and achievable to build early success.
Focusing Only on Negative Consequences. Using the chart primarily as a way to “take away” time creates a hostile environment. Focus on the “Earn” side of the equation. Praise the child when they complete their tasks without being reminded. Positive reinforcement is always more effective than punishment.
Ignoring the “Why.” Parents often forget to explain why screen time is being managed. Explain that screens aren’t “bad,” but that our brains need balance. Use simple analogies about “brain food” and “junk food” to help them understand the purpose behind the chart.
Limitations of Physical Charts
Physical systems have realistic constraints that parents must understand before they begin. They are not a “magic bullet” for every situation.
Lack of Content Monitoring. A chart can tell you *how much* time a child spends on a device, but it cannot tell you *what* they are doing. It won’t block inappropriate websites or monitor social media messages. You still need to stay involved in their digital world to ensure safety.
Portability Issues. A chart on the fridge doesn’t help when you are at a restaurant or on a long car ride. These environments often require a more flexible or verbal version of the system. Transitions away from the home can sometimes break the routine established by the chart.
Difficulty with High-Conflict Teens. For older children who have already developed deep digital dependencies, a sticker chart might feel insulting. Teens usually require a more collaborative, “Digital Wellness Contract” approach rather than a basic chore chart. The system must evolve with the child’s maturity level.
$15/mo Monitoring App vs Zero-Cost Printable Chart
Comparing these two approaches helps you decide which level of maintenance and cost fits your lifestyle. While apps offer automation, charts offer education.
| Factor | Monitoring App | Printable Chart |
|---|---|---|
| Annual Cost | $60 – $180+ | $0 (Free) |
| Ease of Setup | High (Software Install) | Medium (Physical Prep) |
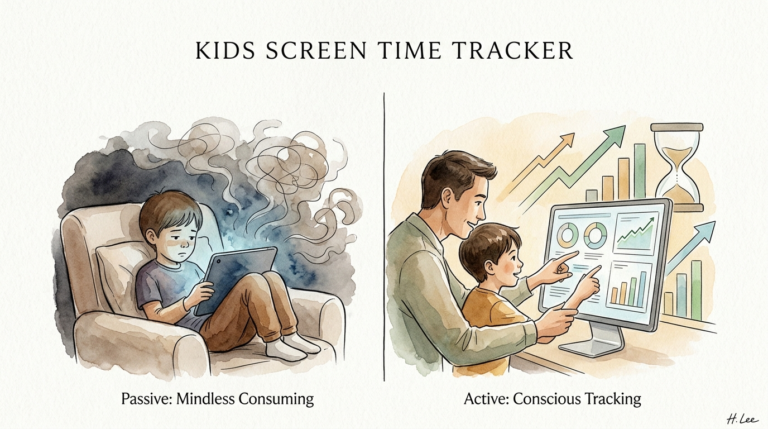
| Child Interaction | Passive (Hidden) | Active (Visible) |
| Trust Level | Low (Surveillance) | High (Collaboration) |
| Maintenance | Automated | Manual (Daily) |
Monitoring apps are often better for families with extreme safety concerns or for parents who are frequently away from home. However, for most families looking to build better habits, the printable chart provides more educational value and less technical frustration.
Practical Tips and Best Practices
Optimization of your chart system can make the difference between a one-week experiment and a long-term habit. Use these tips to increase efficiency.
- Laminate Your Chart. Use a laminator or a clear plastic sleeve. This allows you to use dry-erase markers, making the chart reusable for months. It also protects it from kitchen spills and sticky fingers.
- Use “Bonus” Tokens. Create special tokens for exceptional behavior, like helping a sibling or trying a new food. These can be redeemed for extra “bonus” minutes on the weekend, adding an element of fun and reward.
- The “Charging Station” Rule. Pair the chart with a specific physical location for devices. When the chart says “Time’s Up,” the device must go to the charging station in the kitchen, not the bedroom. This prevents “hidden” usage.
- Model the Behavior. If you expect your kids to follow a chart, you should have your own “Screen-Free Zones.” Children learn more from what you do than what you say. Put your phone away during family meals and chart-review sessions.
Advanced Considerations: Moving Toward Autonomy
The ultimate goal of any screen time chart is to eventually become obsolete. You aren’t raising a child who can follow a chart; you are raising an adult who can manage their own digital wellness.
Scaling the system for older kids involves moving from “minutes” to “outcomes.” Instead of tracking hours, start tracking health indicators. Is their schoolwork done? Are they getting eight hours of sleep? Are they physically active? If the answer is “yes” across the board, the specific number of screen minutes becomes less critical.
Serious practitioners also look at the “Replacement Effect.” Every hour spent on a screen is an hour NOT spent doing something else. Use the chart to actively encourage high-value activities like music, art, or sports. Helping a child find a passion outside of the digital world is the most effective form of screen management.
Example Scenario: The Thompson Family
The Thompsons have two children, ages 7 and 10. They were struggling with “iPad Rage” every evening. They implemented a simple “Earn-It” chart with three morning tasks and two afternoon tasks.
The Tasks:
1. Bed Made (Morning)
2. Teeth Brushed (Morning)
3. School Bag Ready (Morning)
4. 20 Minutes Reading (Afternoon)
5. 15 Minutes Outside Play (Afternoon)
Once all five boxes are checked, the children earn 45 minutes of screen time. If they do an extra chore, they can earn a 15-minute “Plus” token. Within two weeks, the “iPad Rage” disappeared. The children stopped asking for their devices the moment they walked through the door because they knew the path to “earning” them was fixed and fair. The parents stopped nagging, and the kitchen became a calmer environment.
Final Thoughts
Screen time charts for kids are a powerful, low-tech solution to a high-tech problem. They work because they lean into basic human psychology: we all respond better to clear, visual, and predictable systems. By moving the rules from your mouth to the fridge, you reduce conflict and empower your children to make better choices.
Stop relying on expensive apps that act as a digital “bandage.” These tools often mask the underlying issue rather than teaching a skill. A physical chart is a teaching tool that builds the “muscle” of self-control. It is an investment in your child’s future ability to navigate an increasingly digital world.
Experiment with different layouts and reward systems. Every family is unique, and it may take a few tries to find the perfect rhythm. The goal isn’t perfection; it is progress and a more connected, less distracted family life. Start today with a simple piece of paper and watch how quickly the dynamic changes.
Sources
1 letslassothemoon.com | 2 reddit.com | 3 psychologytoday.com | 4 mbdbooks.in | 5 mychoreboard.com | 6 mobicip.com | 7 gentleparentinginstitute.com | 8 cpa.ca | 9 kokoroapp.online | 10 reddit.com | 11 cybernews.com