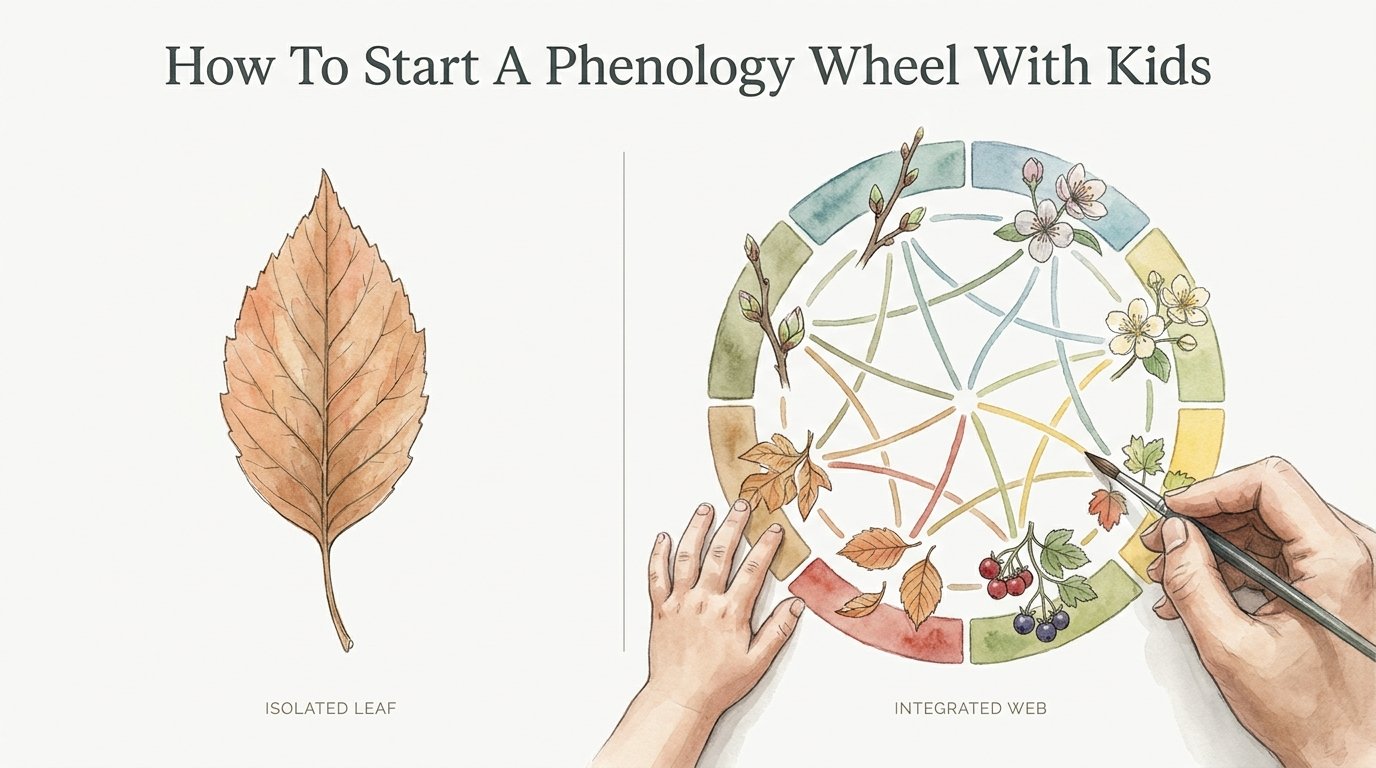
How To Start A Phenology Wheel With Kids
Don’t just teach your child to see the tree; teach them to see the forest it lives in. Most nature journaling is isolated—we look at one flower and move on. Integrated mapping connects the flower to the rain, the pollinators, and the season. This shift from ‘things’ to ‘relationships’ is how you build a genius-level understanding of the world.

When children engage with the natural world, they often see a series of snapshots. They see a bee today, a yellow leaf tomorrow, and a puddle the day after. While these moments are beautiful, they lack the connective tissue that makes science come alive. Integrated mapping through a phenology wheel changes the narrative from “what is this?” to “how does this belong?”
This guide will walk you through the process of creating a phenology wheel with your children. You will learn how to turn a simple piece of paper into a powerful scientific tool. We will explore the mechanics of seasonal cycles and the incredible cognitive benefits of this practice. Prepare to transform your nature walks into deep-dive expeditions of discovery.
How To Start A Phenology Wheel With Kids
A phenology wheel is a circular nature journal that tracks the timing of biological events over a specific period. The term phenology comes from the Greek word “phaino,” which means to show or appear. In the real world, ecologists and climate scientists use phenology to study how plants and animals respond to seasonal changes. Think of it as a biological calendar that records when the first robin arrives, when the maples turn red, or when the first frost hits the garden.
For a child, a phenology wheel is a visual bridge between the passage of time and the physical world. Unlike a standard calendar which is a grid of squares, a wheel reflects the cyclical nature of life. It shows that winter leads to spring, which leads to summer, creating a never-ending loop. This circular format helps children grasp complex concepts like the Earth’s orbit and the rhythm of the seasons without needing a textbook.
Imagine your backyard as a living clock. The phenology wheel is the face of that clock. Each “slice” of the pie represents a segment of time—usually a month—where your child records their most significant observation. Whether you live in a dense city or a rural forest, the wheel works everywhere because nature is always in motion. Even the changing angle of the sun on a brick wall is a phenological event worth recording.
How to Create Your First Phenology Wheel
Starting this project requires very few materials but a high level of curiosity. You can choose to make a large family wheel or give each child their own individual record. Individual wheels are often better for developing personal observation skills and artistic confidence.
Step 1: Gathering Your Supplies
You do not need professional-grade art supplies to begin. A piece of sturdy cardstock or watercolor paper works best because it can handle different mediums. You will also need a compass or a large round plate to trace your initial circle. A ruler is essential for dividing the wheel into equal sections, and a pencil is better than a pen for the initial layout.
Step 2: Designing the Layout
Most beginners start with a 12-month wheel. Trace a large circle and then a smaller circle inside it to create a border. Use your ruler to divide the circle into 12 equal wedges, much like a clock face. Label the outer border with the names of the months. For younger children, you might want to color-code these sections based on the seasons: blues for winter, greens for spring, yellows for summer, and oranges for autumn.
Step 3: Defining the Core Focus
Decide what your child will track. You might focus on a “Calendar of Firsts,” where they record the first time they see a specific bird or flower each month. Alternatively, you could choose one “Sit Spot”—a single tree or a patch of grass—and document how it changes every 30 days. This focused approach prevents the project from feeling overwhelming and helps kids notice the subtle shifts that others miss.
Step 4: The Monthly Observation
Set a consistent date each month to fill in the wheel. Some families choose the first of the month, while others prefer the full moon or the solstice. Take your child outside and ask them to find one thing that represents the current season. Is it the way the light hits the grass? Is it the presence of a specific insect? Have them sketch their observation in the corresponding slice of the wheel.
Benefits of the Integrated Mapping Approach
Using a phenology wheel offers measurable benefits that go far beyond “making pretty pictures.” It engages multiple parts of the brain simultaneously, combining artistic expression with rigorous scientific inquiry. This approach moves the child from an “Isolated Leaf” mindset to an “Integrated Web” perspective.
Development of Observation Skills: In a world of fast-paced digital media, phenology forces a child to slow down. They learn to look for the “micro-changes”—the swelling of a bud, the changing texture of bark, or the specific shade of a bird’s feathers. This heightened awareness is a foundational skill for any future scientist or artist.
Math and Spatial Reasoning: Creating the wheel involves geometry and fractions. Dividing a circle into 12 equal parts or tracking 31 days in a month-long wheel requires precision and planning. Children naturally learn about degrees, angles, and the division of time while they are busy with their art.
Connection to Local Ecosystems: Phenology wheels build “place-based” knowledge. Instead of learning about generic lions in a book, children learn about the specific squirrels and oak trees in their own neighborhood. This creates a sense of stewardship and belonging. When a child knows exactly when the local milkweed usually blooms, they become a protector of that specific habitat.
Cognitive Processing and Memory: Research shows that the act of drawing an observation helps with “encoding” information into long-term memory. Writing “the leaf is green” is far less effective than spending ten minutes trying to match the exact shade of green with a colored pencil. The kinesthetic and visual effort creates a more durable mental record of the learning experience.
Challenges and Common Mistakes
Many families start a phenology wheel with great enthusiasm in January only to have the project gather dust by March. Understanding the common pitfalls can help you maintain the momentum needed to complete a full year-long cycle.
Overcomplicating the Artwork: Perfectionism is the enemy of the phenology wheel. Children—and parents—often feel pressured to create a masterpiece every month. When a child feels their drawing isn’t “good enough,” they may want to quit. Remind them that the wheel is a data tool first and an art project second. Stick figures and simple labels are perfectly acceptable.
Inconsistency in Observation: Life gets busy, and it is easy to forget your monthly check-in. If you miss a month, don’t abandon the whole project. Simply leave the space blank or fill it in with a memory of what the weather was like. The goal is to build a habit of noticing, not to create a flawless document.
Lack of Context: Sometimes kids record things that aren’t actually related to the season, like a toy they found outside. While this is cute, it doesn’t build phenological understanding. Guide them back to the natural cycles by asking questions like, “What is different about the trees today compared to last month?” or “Where are the bees today?”
Limitations of the Phenology Wheel
While the phenology wheel is an incredible tool, it does have practical boundaries. Recognizing these limitations will help you manage expectations and choose the right version of the project for your specific environment.
Geographic Constraints: If you live in a region with very subtle seasonal changes, like the tropics, a standard 12-month wheel based on “Spring, Summer, Fall, Winter” might not make sense. In these cases, you may need to track “Wet Season vs. Dry Season” or focus exclusively on the lunar cycle to see meaningful shifts.
Urban Environmental Barriers: Children in urban environments might feel they have “nothing to record.” In a concrete jungle, the changes are less about forests and more about the movement of shadows, the appearance of weeds in sidewalk cracks, or the migration of birds seen from a window. The method must be adapted to the child’s actual reality to be successful.
Long-Term Commitment: A year is a very long time for a young child. Younger children (ages 4–6) may benefit more from a weekly wheel or a “one-month” wheel divided into 30 days. Forcing a toddler into a 12-month commitment can turn a fun activity into a chore that creates resentment toward nature study.
Comparison: Isolated Leaf vs. Integrated Web
To truly understand the value of phenology wheels, we must look at the difference between traditional nature journaling and integrated mapping. This distinction is what separates a hobbyist from a deep thinker.
| Feature | Isolated Leaf Journaling | Integrated Web Mapping |
|---|---|---|
| Core Goal | To document a single object beautifully. | To document the timing and relationship of events. |
| Format | Linear pages in a notebook. | Circular wheel reflecting natural cycles. |
| Main Question | “What is this?” | “When does this happen and why?” |
| Data Value | Low; snapshots are hard to compare. | High; patterns emerge over seasons. |
Practical Tips for Success
Implementing a phenology wheel should feel like a natural part of your family’s rhythm. Use these tips to ensure the project remains engaging and educational throughout the entire year.
- Use a Sit Spot: Choose one specific location that you visit every single month. It could be a single tree in the park or even a window box. Seeing the same subject change over time is much more powerful than drawing random objects from different locations.
- Integrate Metadata: Encourage older children to add “metadata” to their wheel. This includes the date, the high/low temperature, and the phase of the moon. This turns the art project into a legitimate scientific record.
- Keep it Visible: Don’t tuck the phenology wheel away in a drawer. Tape it to the refrigerator or a prominent wall. Seeing the wheel every day serves as a visual reminder of the progress you’ve made and the “slices” that are still waiting to be filled.
- Make it a Group Activity: Children are more likely to stay committed if they see you doing it too. Maintain your own wheel alongside theirs. This allows for interesting comparisons at the end of the month—did you notice the same things?
Advanced Considerations for Serious Practitioners
Once your child has mastered the basic 12-month wheel, you can introduce more complex concepts to deepen their understanding. These adjustments move the project from “general nature study” into “advanced ecological monitoring.”
Lunar Phenology: Instead of tracking the calendar months, try tracking a single moon cycle (approx. 29.5 days). Divide the wheel into 30 sections and record the moon’s shape and the nightly temperature. This is excellent for teaching children about the Earth-Moon-Sun relationship.
Citizen Science Integration: Your child’s observations can actually help real-world scientists. Programs like “Nature’s Notebook” or “Budburst” allow you to submit phenological data online. If your child records that the first lilac bloomed on April 12th, that data point can be used by researchers to track climate change trends. Knowing their work “counts” for real science is a massive motivator for older kids.
Multi-Year Comparisons: The real magic happens in the second year. If you keep your first year’s wheel and start a new one for the second year, you can compare them side-by-side. Why did the flowers bloom two weeks earlier this year? Was there more rain? This is where true critical thinking and hypothesis-building begin.
Example Scenario: The Oak Tree Project
Let’s look at how a 9-year-old named Leo used a phenology wheel to study a single white oak tree in his backyard over one year. This example demonstrates the “Integrated Web” approach in action.
In January, Leo noticed the tree looked “dead,” but when he looked closer, he saw tiny, hard brown buds. He sketched the silhouette of the bare branches. By April, he recorded that the buds had finally burst into tiny, velvet-like leaves. He also noted the return of a specific squirrel that began building a nest.
In July, the tree was a deep, vibrant green. Leo used his wheel to record the sound of cicadas screaming in the branches and the way the shade kept the grass underneath it cooler than the rest of the yard. By October, he drew the brown acorns falling to the ground and noted that the leaves didn’t turn bright red like the maples, but a dusty copper. Finally, in December, he saw a woodpecker visiting the trunk, looking for insects hiding in the bark. At the end of the year, Leo didn’t just have 12 drawings; he had a complete biography of that tree’s life cycle.
Final Thoughts
A phenology wheel is more than just a craft; it is a mindset. It teaches children that they are not separate from nature, but part of a larger, breathing system. By tracking the seasons, they learn the value of patience, the importance of detail, and the beauty of persistence. This is the foundation of scientific literacy and environmental empathy.
The transition from “Isolated Leaf” to “Integrated Web” mapping is a journey that lasts a lifetime. Starting this practice in childhood ensures that the next generation grows up with their eyes wide open to the relationships that sustain our planet. It turns a simple walk in the woods into a masterclass in global ecology.
Don’t wait for the “perfect” time to start. Because the wheel is a circle, you can jump in at any point in the year. Grab a piece of paper, trace a plate, and head outside. The forest is waiting to be seen, and your child is ready to see it.
Sources
1 btarboretum.org | 2 shillerlearning.com | 3 librarianinthehouse.com | 4 santacruzmuseum.org | 5 spottyotter.co.uk | 6 jackbenimblekids.com | 7 moscow.id.us | 8 chandrimadebi.blog | 9 nicrn.org | 10 hatchingcuriosity.com | 11 littletruthsstudio.com | 12 berkeley.edu | 13 commonthreadsfarm.org