screen time tracker yearly
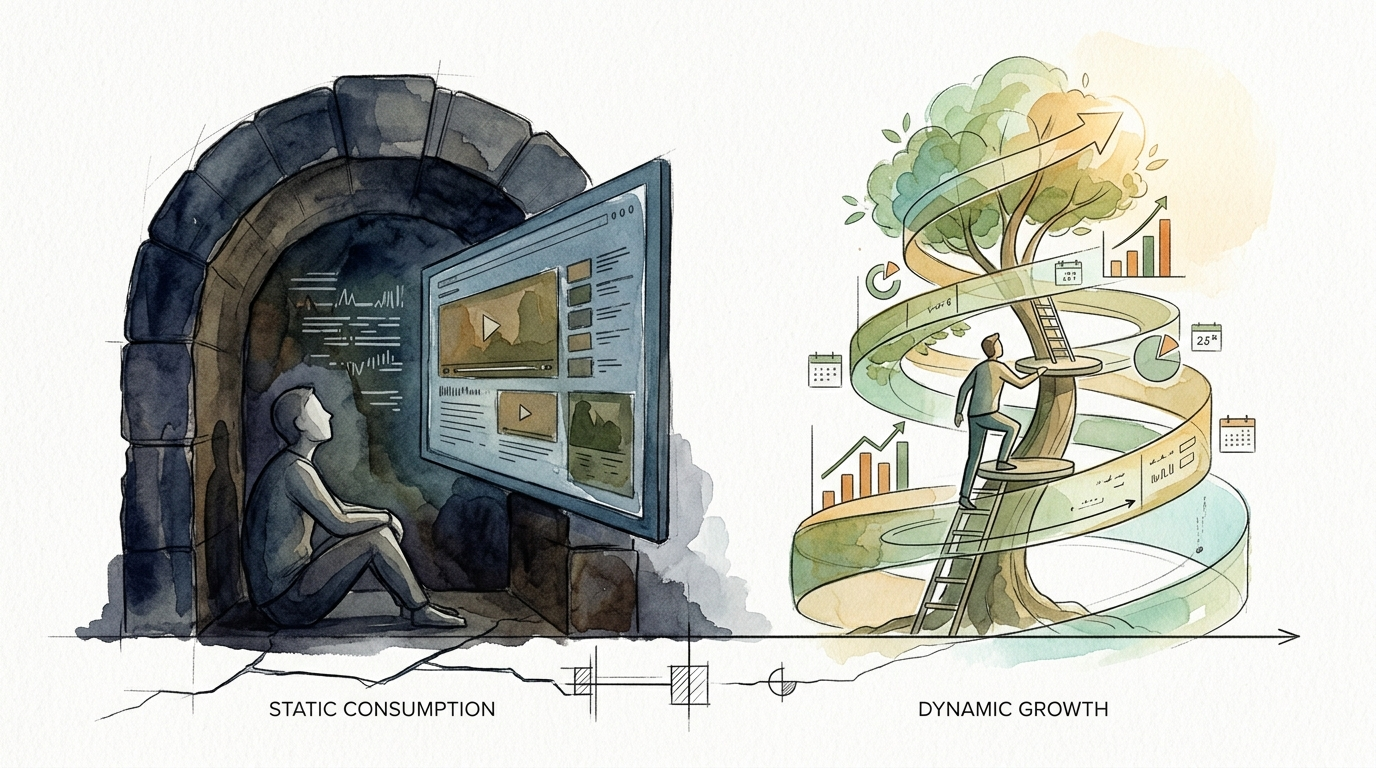
Your time is a fixed resource. Where is it flowing? A yearly tracker isn’t just a guilt trip; it’s a map for reclamation. See the visual difference between hours lost to the void and hours invested in your own potential.
Most of us live our lives in seven-day loops. We look at a weekly notification, feel a brief sting of regret, and then do it all over again. But a weekly snapshot is a lie of omission. It hides the compounding debt of thousands of hours spent in the digital ether.
Checking your phone 96 times a day might feel like a series of small choices. Over a year, those choices add up to over 35,000 interruptions. You aren’t just losing minutes; you are losing the ability to maintain deep focus. This guide helps you zoom out and confront the true scale of your digital life.
screen time tracker yearly
A screen time tracker yearly is a high-level diagnostic tool that aggregates your digital usage over 365 days. While native apps on your phone focus on the “now,” a yearly view reveals the “always.” It shows you who you are becoming based on where you put your attention.
On average, people worldwide spend about 6 hours and 51 minutes on screens every day. In the United States, that number climbs to over 7 hours. When you do the math, that is roughly 2,500 hours a year. To put that in perspective, a full-time job at 40 hours a week for 50 weeks is only 2,000 hours.
You are essentially working a full-time job as a professional consumer. The yearly tracker exists to turn those abstract hours into a concrete balance sheet. It is used by productivity enthusiasts, parents, and anyone feeling the “brain fog” of the digital age to reclaim their most valuable asset.
Think of it like a financial audit. You might not notice a $5 coffee every day, but you definitely notice a $1,825 annual bill for caffeine. A yearly tracker does the same for your focus. It highlights the “subscriptions” you never signed up for—like the 500 hours spent on short-form video loops.
How to Audit Your Digital Year
Tracking your time over a full year requires a mix of native tools and third-party systems to bridge the gap between devices. Most phones only keep detailed data for a few weeks, so you have to be proactive about saving your history.
Start with your primary device. For iPhone users, go to Settings > Screen Time. While Apple provides weekly reports, you can see longer trends by viewing the “See All App & Website Activity” section and toggling between weeks. To get a yearly view, you often need to manually record these weekly totals in a spreadsheet.
Android users can find similar data in Settings > Digital Wellbeing & Parental Controls. The dashboard shows you a breakdown of your most-used apps. For a truly annual perspective, use an app like StayFree or ActionDash. These tools allow you to export your data into a CSV format, which is essential for a year-end review.
Desktop tracking is the missing piece for most people. Tools like RescueTime or ActivityWatch run in the background of your Mac or PC. They categorize your time automatically into “Productive” versus “Distracting.” Because these services store data in the cloud, you can log in at the end of December and see exactly how many hours you spent in Excel versus how many you spent on YouTube.
- Export Monthly: Set a calendar reminder on the 1st of every month to save your screen time data.
- Use Cross-Platform Tools: Apps like StayFree sync between your phone and your browser to give you a unified total.
- Categorize Manually: Don’t just look at “Social Media.” Label apps as “Static Consumption” or “Dynamic Growth” to see the quality of your time.
The Benefits of the 365-Day View
The biggest advantage of a yearly tracker is the “Shock Factor.” It is easy to ignore three hours of TikTok on a Tuesday. It is impossible to ignore 1,000 hours of TikTok when it is presented as “41 days of your life spent scrolling.” This clarity is the strongest catalyst for change.
Tracking over a year helps you identify seasonal patterns. You might notice your screen time spikes during winter months or during high-stress periods at work. Recognizing these triggers allows you to build better systems before the next cycle starts. You can prepare “analog” alternatives for your high-risk seasons.
Long-term tracking also validates your progress. If you reduce your daily usage by just 30 minutes, you won’t feel much of a difference in a week. Over a year, however, that is 182 hours of reclaimed time. That is enough time to learn a new language, start a side business, or read 30 books. The yearly view turns small wins into massive achievements.
Challenges and Common Pitfalls
Fragmented data is the primary hurdle. Most people use a phone, a tablet, and a laptop. If you only track your phone, you are missing the hours spent on Netflix or desktop browsing. This leads to a false sense of security where you think you are doing well because your “Phone Screen Time” is down, even though your total digital consumption remains high.
The “Guilt Trap” is another major risk. Looking at a year of wasted time can be paralyzing. Some people see the numbers and feel so much shame that they delete the tracker and go back to mindless scrolling. Remember that the tracker is a tool for the future, not a trial for the past. Information is the first step toward sovereignty.
Over-tracking can also become its own form of distraction. If you spend hours every week fiddling with categories and color-coding your spreadsheets, you are just trading one screen for another. The goal is to spend less time on screens, not more time managing the tracking of them.
Limitations of Yearly Tracking
Context is often missing from the data. Your phone can’t tell the difference between a FaceTime call with your grandmother and a mindless scroll through a celebrity’s Instagram feed. Both show up as “Social.” This lack of nuance can make productive users feel like they are failing when they are actually using their devices effectively.
Background activity can also skew the numbers. If you use your phone for GPS while driving or listen to podcasts while working out, your “Screen Time” might look astronomical. These are passive uses that don’t necessarily drain your mental energy the same way active scrolling does. You have to learn to filter out the noise in your data.
Device updates and software bugs can occasionally wipe out weeks of data. Relying solely on a single app without backups is a recipe for a broken yearly report. Always try to use tools that allow for local or cloud backups of your usage history.
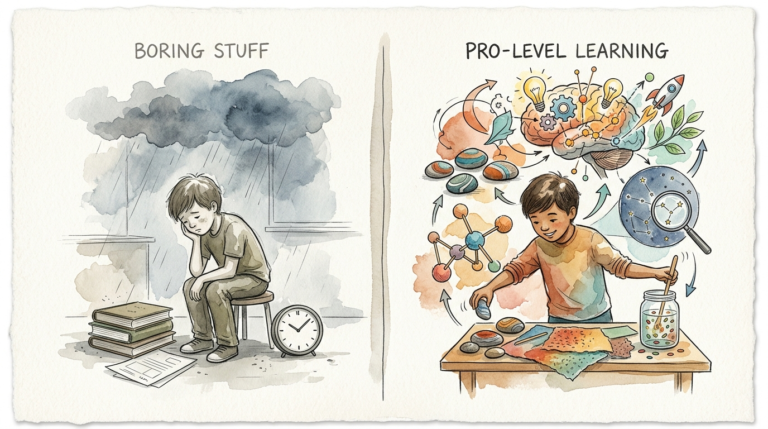
Static Consumption vs. Dynamic Growth
Not all digital hours are created equal. To understand your yearly report, you must distinguish between Static Consumption and Dynamic Growth. This distinction determines whether your technology is a tool or a tether.
| Feature | Static Consumption | Dynamic Growth |
|---|---|---|
| User Role | Passive Observer | Active Creator / Student |
| Input Type | Infinite Feeds (TikTok, Reels) | Tools (Notion, Figma, IDEs) |
| Mental State | Reactive / Low Energy | Focused / High Energy |
| Outcome | Dopamine Spike & Crash | Skill Acquisition / Work Output |
| Complexity | Low (Swipe/Tap) | High (Synthesis/Problem Solving) |
Static consumption is designed to keep you in a state of “continuous partial attention.” It provides immediate, low-effort rewards. Dynamic growth, on the other hand, often feels difficult. It involves using your screen as a canvas or a library. A healthy yearly tracker should show a shrinking percentage of static hours and a growing percentage of dynamic ones.
Practical Tips for Digital Reclamation
Use the “Gray Scale” trick. By turning your phone to black and white in the accessibility settings, you make the colorful icons of social media less enticing. It breaks the visual reward loop that keeps you clicking. This is especially effective for reducing yearly totals on “Static” apps.
Create a “Charging Station” outside of your bedroom. Research shows that checking your phone within two hours of sleep disrupts your circadian rhythm and increases cortisol. Moving the phone away ensures you start and end your day in an analog state. Over a year, this habit alone can save you hundreds of hours of late-night “revenge bedtime procrastination.”
Audit your notifications relentlessly. If an app doesn’t need to tell you something in real-time to prevent a crisis, turn off its alerts. Every “ping” is an attempt to hijack your yearly time budget. Use Focus Modes on iOS or Work Profiles on Android to batch your notifications so you only see them when you choose to.
Advanced Considerations for Practitioners
Serious practitioners use “Friction as a Service.” This involves making the apps you want to use less (Static) harder to access while making the apps you want to use more (Dynamic) easier. You might delete the Instagram app and only use it via a mobile browser. The clunky interface and extra login step act as a barrier to mindless entry.
Consider the concept of “Digital Sovereignty.” This is the idea that you should have full control over your data and your attention. Advanced users often set up local-first tracking systems like ActivityWatch that don’t send data to the cloud. This protects your privacy while still giving you the deep analytics needed for a yearly audit.
Analyze your “Pickups” and “First App Used” data. Your yearly tracker can tell you which app usually starts a “distraction spiral.” If your first pickup of the day is often an email app or a news feed, you are training your brain to be reactive from the moment you wake up. Changing that first app to a journal or a meditation tool can shift your entire yearly trajectory.
Scenario: The Tale of Two Years
Imagine User A and User B. Both have a daily screen time of 6 hours. On the surface, their yearly reports look identical. However, when we look closer at the categories, a different story emerges.
User A spends 5 hours a day on “Social Media” and “Entertainment.” Over a year, they have consumed 1,825 hours of content. They have seen thousands of ads, hundreds of memes, and dozens of controversies. At the end of the year, they feel exhausted and haven’t gained any new skills.
User B spends 1 hour on social media to stay connected, but spends 5 hours using their iPad and Apple Pencil to learn digital illustration and 3D modeling. Over a year, they have also spent 1,825 hours on their screen. However, User B ends the year with a professional portfolio and a new career path. The tracker shows the same number, but the Dynamic Growth focus changed the outcome of their life.
Final Thoughts
Your screen time is not a moral failing; it is the result of a multi-billion dollar industry designed to capture your attention. A yearly tracker is your way of fighting back. It provides the high-level perspective needed to see where your life is leaking away and gives you the data to plug those holes.
Start today by checking your current weekly average. Multiply that number by 52 to see your projected yearly total. If that number scares you, use that fear as fuel. You don’t have to quit the internet; you just have to stop being its product. Transition from a passive consumer to an active creator.
Experiment with one or two tracking tools this month. Build the habit of checking in with your data without judgment. Over time, you will find that the visual evidence of your time usage makes it much easier to put the phone down. Reclaim your 2,500 hours and see what you can build with them.
Sources
1 demandsage.com | 2 jaimedicalsystems.com | 3 youthfirstinc.org | 4 youtube.com | 5 twilio.com | 6 wheatstateinsurance.com | 7 cbsnews.com | 8 lifestack.ai | 9 google.com | 10 passport-photo.online