screen time tracker
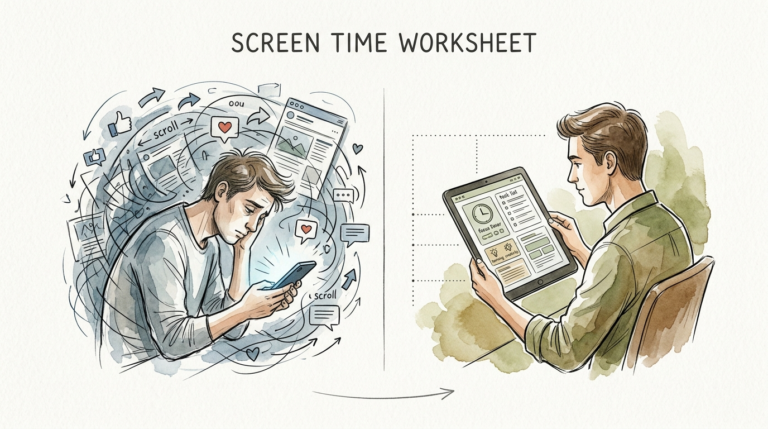
We track what we value. Are you only tracking the time they spend in the ‘digital city’? Don’t just look at how much time they spent on TikTok. Track how much time they spent in the sun. Balance is everything.

In our hyper-connected world, your smartphone is more than a phone. It is your bank, your map, your social life, and your office. Because these devices are so integrated into our lives, it is easy to lose track of where the hours go. Most people believe they spend “a couple of hours” on their phones, but the data tells a different story. Recent global averages show that the average person now spends 6 hours and 45 minutes staring at screens every single day. If you live to the average life expectancy, that translates to over 19 years of your life spent looking at a digital display.
Understanding this “digital city” we inhabit requires a map. That map is the screen time tracker. This tool is no longer just a parental control feature; it is a vital instrument for anyone looking to reclaim their attention, improve their mental health, and find a balance between the glowing rectangles and the real world.
screen time tracker
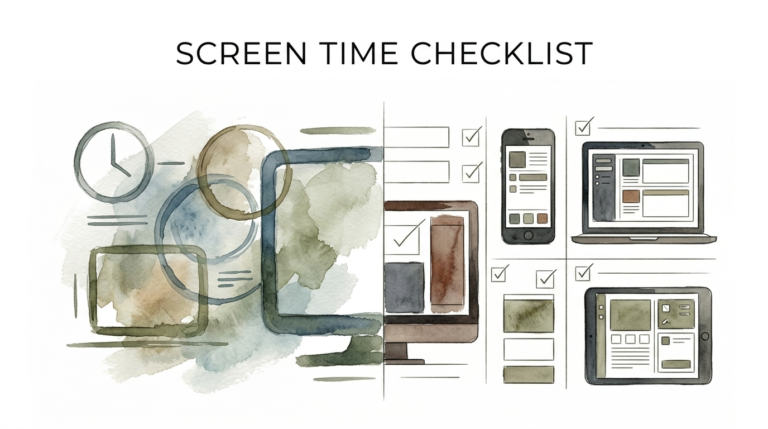
A screen time tracker is a software utility designed to monitor and report the amount of time spent on electronic devices, specifically looking at individual applications and websites. It serves as a digital mirror, reflecting your habits back to you with brutal, data-driven honesty. These trackers exist on almost every modern platform, including smartphones, tablets, laptops, and even some smart TVs.
In real-world situations, a screen time tracker acts as a diagnostic tool. For a professional, it might reveal that “quick” checks of LinkedIn actually consume 45 minutes of a productive morning. For a parent, it provides a factual basis for setting boundaries rather than relying on guesses and arguments. These tools categorize usage into buckets like “Social,” “Productivity,” “Entertainment,” and “Education,” allowing you to see not just *how much* you use your device, but *how* you use it.
Think of it like a financial budget for your attention. Just as you track where every dollar goes to ensure you can afford what you value, you should track where every minute goes to ensure you aren’t bankrupting your focus on low-value scrolling.
How Screen Time Tracking Systems Work
Modern screen time trackers operate through deep integration with the device’s operating system (OS). Because the OS manages which applications are active and visible, it can log exactly when a user switches from one task to another.
Most native systems, like Apple’s Screen Time or Android’s Digital Wellbeing, use high-level system APIs to monitor “foreground” app activity. When you tap an icon, the system records a “start” timestamp. When you exit the app or the screen goes dark, it records an “end” timestamp. These logs are then aggregated into daily and weekly reports.
Third-party trackers often have a harder time getting this granular data due to privacy restrictions. To work around this, some third-party apps on desktop platforms use “active window” monitoring, where the software checks the name of the application currently in the foreground every few seconds. On mobile, some apps use a local Virtual Private Network (VPN) or Accessibility Services to see which URLs or apps are being accessed, though this is often more battery-intensive than native solutions.
The process of categorization is usually automated. Apps are assigned categories based on their metadata in the App Store or Play Store. If you spend three hours on a “Social” app, the tracker doesn’t care if you were networking for a job or looking at memes; it simply logs the category and the duration.
Benefits of Active Tracking
The primary advantage of using a screen time tracker is the move from “perceived usage” to “actual usage.” Studies consistently show that humans are poor at estimating their own behavior, often underestimating their phone use by as much as 50%.
Active tracking provides several measurable benefits:
- Increased Self-Awareness: Seeing a notification that you spent 25% more time on Instagram this week than last week acts as a psychological nudge to adjust your behavior.
- Improved Productivity: By identifying “time-sink” apps, you can set hard limits that physically prevent you from accessing distractions during work hours.
- Better Sleep Hygiene: Most trackers include “Downtime” or “Bedtime” modes that gray out the screen or block notifications, helping to reduce blue light exposure and mental stimulation before sleep.
- Reduced Digital Anxiety: Paradoxically, knowing exactly how much time you spend on your phone can reduce the vague “guilt” of feeling like you’re always on it. Data replaces anxiety with a plan.
For families, these tools foster transparency. Instead of a parent accusing a child of being “on that phone all day,” they can look at a report together. It moves the conversation from an emotional conflict to a collaborative goal-setting session.
Challenges and Common Mistakes
The biggest challenge with screen time trackers is the “Guilt Loop.” When a user sees a high number, they may feel a sense of failure or shame. Instead of motivating change, this guilt often leads to “avoidance behavior,” where the user stops checking the reports entirely to avoid the negative feelings.
Another common mistake is treating all screen time as “bad” time. A screen time tracker is a blunt instrument. It cannot distinguish between 60 minutes spent reading a classic novel on a Kindle app and 60 minutes spent doom-scrolling on a news feed. If you use your phone for work, your “Productivity” time will naturally be high. Users often make the mistake of trying to get their total number as low as possible without considering the *quality* of the time spent.
Pitfalls to watch for include:
- The “Ignore Limit” Habit: Most trackers have a button that allows you to “Ignore for 15 minutes.” If you find yourself hitting this button five times a day, the tracker has become a ritual of failure rather than a tool for change.
- Inconsistent Tracking: If you track your phone usage but not your laptop or tablet usage, you are only seeing a fraction of your “digital city.” This leads to a false sense of accomplishment.
- Missing the Context: High screen time during a crisis or a particularly busy work week is normal. Users often get discouraged by these spikes instead of viewing them as temporary outliers.
Limitations of the Data
While a screen time tracker is powerful, it has realistic constraints. Environmental limitations are a major factor. For example, if you use your phone for GPS navigation while driving, the tracker may log that as two hours of “Maps” usage. Technically, the screen was on, but you weren’t “using” the device in a way that drains your mental focus.
There are also practical boundaries to the technology:
- Shared Devices: In many households, tablets are shared. A tracker on a shared iPad won’t tell you who was using it, making the data useless for individual habit-forming.
- Background Activity: Some apps, like Spotify or Podcast players, run in the background. While native trackers are getting better at excluding “Audio Only” time from the total, some third-party tools still struggle to separate active interaction from passive listening.
- Privacy Trade-offs: To get the most accurate data, you often have to grant an app deep permissions. For some users, the benefit of tracking is not worth the risk of a third-party app seeing their browsing history or app habits.
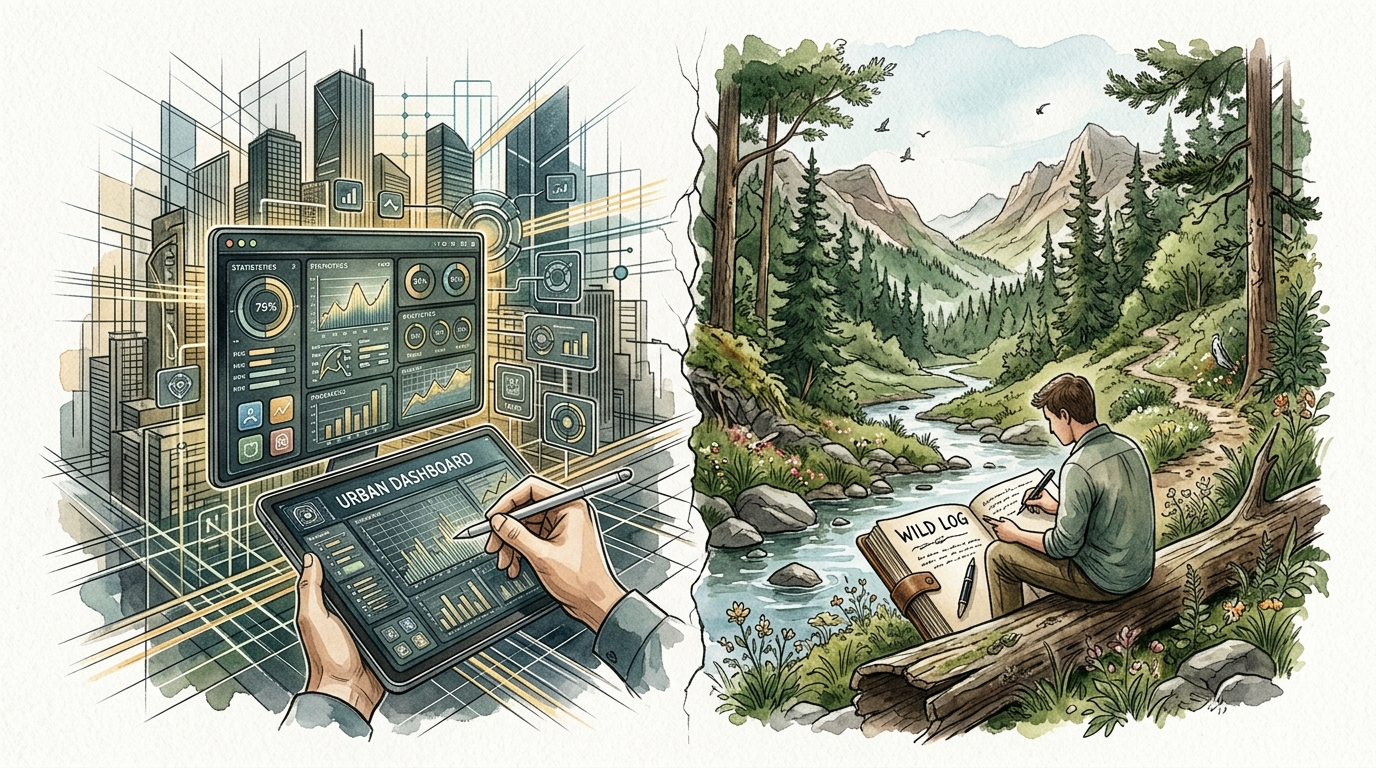
It is important to remember that the screen time tracker is the “Urban Dashboard.” It tells you everything about your life inside the machine, but it tells you nothing about your life outside of it. It cannot track the “sun” or the “green time” unless you manually input that data elsewhere.
The Urban Dashboard vs. The Wild Log
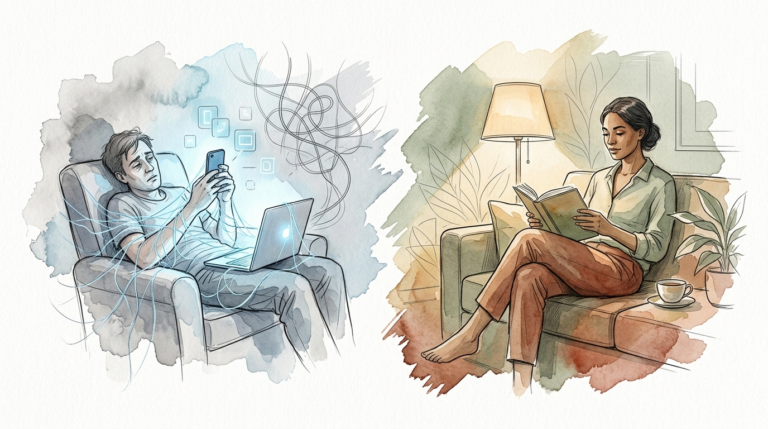
To truly find balance, you must compare your digital metrics with your physical ones. The “Urban Dashboard” is your screen time tracker—it’s automated, high-tech, and often overwhelming. The “Wild Log” is the record of your time spent in the sun, moving your body, and interacting with nature.
| Feature | The Urban Dashboard (Screen Time) | The Wild Log (Outdoor Time) |
|---|---|---|
| Tracking Method | Automated, OS-level logging. | Manual logging or GPS/Wearable tracking. |
| Primary Metric | Minutes/Hours spent in apps. | Minutes/Hours of “Green Time” or Sunlight. |
| Psychological Effect | Can lead to guilt or “Digital Fatigue.” | Associated with reduced stress and improved mood. |
| Goal | Reduction and Optimization. | Expansion and Consistency. |
This comparison highlights that we often spend all our energy optimizing the dashboard we dislike (our phone use) while ignoring the one that actually sustains us (our connection to the environment).
Practical Tips for Better Tracking
If you want to move beyond just looking at the numbers and start changing them, follow these best practices:
- Set “Actionable” Limits: Instead of a broad limit on “Social Media,” set a limit on the one app that sucks you in the most. Start with a limit that is only 10% lower than your current average. Small wins build momentum.
- Use “Grayscale” Mode: Many trackers allow you to trigger a grayscale screen when you hit a limit. Removing the color makes the apps significantly less stimulating and easier to put down.
- Name Your “Digital Sinks”: Every user has one or two apps where time disappears. Identify yours. Is it TikTok? Is it mobile games? Is it the news? Put those apps on a secondary screen or inside a folder to increase the friction of opening them.
- Sync Across Devices: Ensure your screen time tracker is pulling data from your phone, your iPad, and your Mac. If you only limit Instagram on your phone, you will likely just start using it on your laptop.
- Schedule “No-Phone” Blocks: Use the “Downtime” feature to lock your phone during the first hour of the day and the last hour before sleep. Protecting these windows is the fastest way to improve your mental clarity.
Advanced Considerations for Power Users
For those who want to go deeper, several advanced strategies can turn a basic screen time tracker into a sophisticated behavioral change engine.
Data Export and Analysis: Some apps, like RescueTime or Toggl, allow you to export your usage data as a CSV file. Serious practitioners can use this data to find correlations between their screen use and their productivity or mood. For example, you might find that on days you spend more than 30 minutes on news apps before 9:00 AM, your total productive output for the day drops by 20%.
API Automation: Using tools like IFTTT or Zapier, you can trigger real-world consequences based on your screen time. For example, you could set an automation that turns off your smart lights or plays a specific “focus” playlist when you hit your daily limit for entertainment apps.
Gamified Hard-Blocking: Apps like Opal or Freedom offer “Deep Focus” modes that are nearly impossible to bypass. These use local VPN configurations to block app traffic at the network level. This is the “nuclear option” for those with severe digital distractions, as it removes the “Ignore” button entirely.
Real-World Examples of Tracking Success
The Remote Worker: Sarah found that she was working 10-hour days but felt she was getting nothing done. Her screen time tracker revealed she was spending over 3 hours a day on Slack and Email, but in “bursts” of 5-10 minutes every hour. By using a tracker to set “Downtime” for communication apps, she began “batching” her messages. Her screen time on those apps stayed the same, but her deep work sessions tripled in length.
The Parent: Mark noticed his son was becoming irritable in the evenings. They looked at the screen time tracker together and saw that his son was playing a high-intensity battle royale game for three hours straight right before dinner. They didn’t ban the game, but they used the tracker to set a “Hard Stop” at 5:30 PM, allowing an hour of “no-screen” time before dinner. Within a week, the evening irritability vanished.
The Student: Leo was struggling with late-night scrolling. He set his screen time tracker to turn his phone to grayscale at 10:00 PM and block all social apps at 11:00 PM. The visual change acted as a “soft” reminder to start winding down, and the hard block prevented the “just one more video” loop that often kept him up until 2:00 AM.
Final Thoughts
A screen time tracker is not a judge; it is a witness. It provides the data you need to make informed decisions about how you spend your most precious resource: your time. By moving from mindless consumption to intentional use, you can stop living in the “digital city” and start living in the real world.
The goal is not to reach zero screen time. In a digital society, that is neither practical nor necessary. The goal is balance. When you look at your reports, remember to ask yourself if that time was spent building something, learning something, or truly connecting with someone. If the answer is no, use the tools at your disposal to course-correct.
Don’t just track the time you spend on TikTok. Track the time you spend in the sun. Start your “Wild Log” today, and use your screen time tracker to make sure the “Urban Dashboard” never takes over the whole map. Experiment with different apps, find the limits that work for you, and reclaim your attention one minute at a time.
Sources
1 kidslox.com | 2 harmonyhit.com | 3 blankspaces.app | 4 tivazo.com | 5 psu.edu | 6 focuskeeper.co | 7 psychologytoday.com | 8 webwork-tracker.com | 9 goalsandprogress.com | 10 youtube.com | 11 youtube.com | 12 youtube.com | 13 luriechildrens.org | 14 awisee.com | 15 apa.org | 16 screensdownfamilyup.com | 17 spsp.org | 18 habi.app | 19 canopy.us | 20 nextgrowthlabs.com | 21 medium.com