Topography Activities For Kids
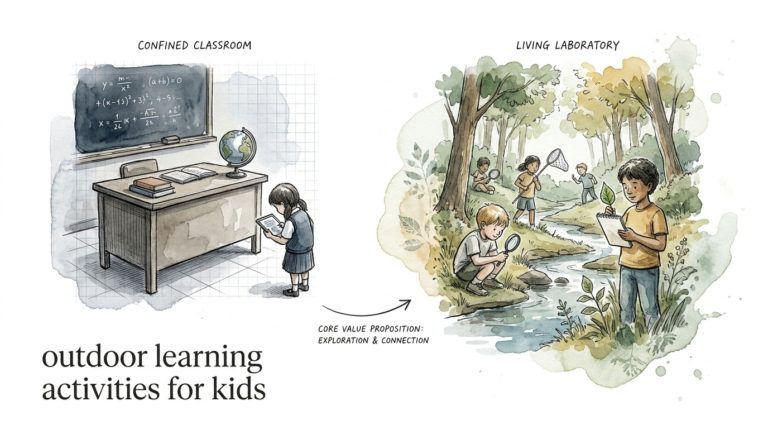
Paper maps show your child where things are; 3D topography shows them how the earth actually works. The world isn’t flat, so why are we teaching geography with 2D drawings? Grab some clay and head outside. When a child has to sculpt the ‘slow rise’ of the backyard hill or the ‘dip’ where the rain collects, they aren’t just mapping—they’re internalizing the flow of the land.
Topography Activities For Kids
Topography is the study of the shape and features of the Earth’s surface. It represents the three-dimensional “lay of the land” on a two-dimensional surface. For a child, a flat map is often just a collection of abstract colors and squiggly lines. 3D topography turns that abstraction into a physical reality they can touch, build, and change.
This field exists because humans need to understand elevation to survive and thrive. Civil engineers use it to design roads that don’t flood. Hikers use it to avoid walking off cliffs. Even urban planners rely on these maps to decide where the next neighborhood should go. In the real world, topography is about movement and gravity.
Think of a topographic map like a layer cake. Each layer represents a specific height above sea level. When you look at the cake from the side, you see the height. When you look from the top down, you see the shapes of the layers stacked on each other. These “layers” are what we call contour lines, and they are the secret code of geography.
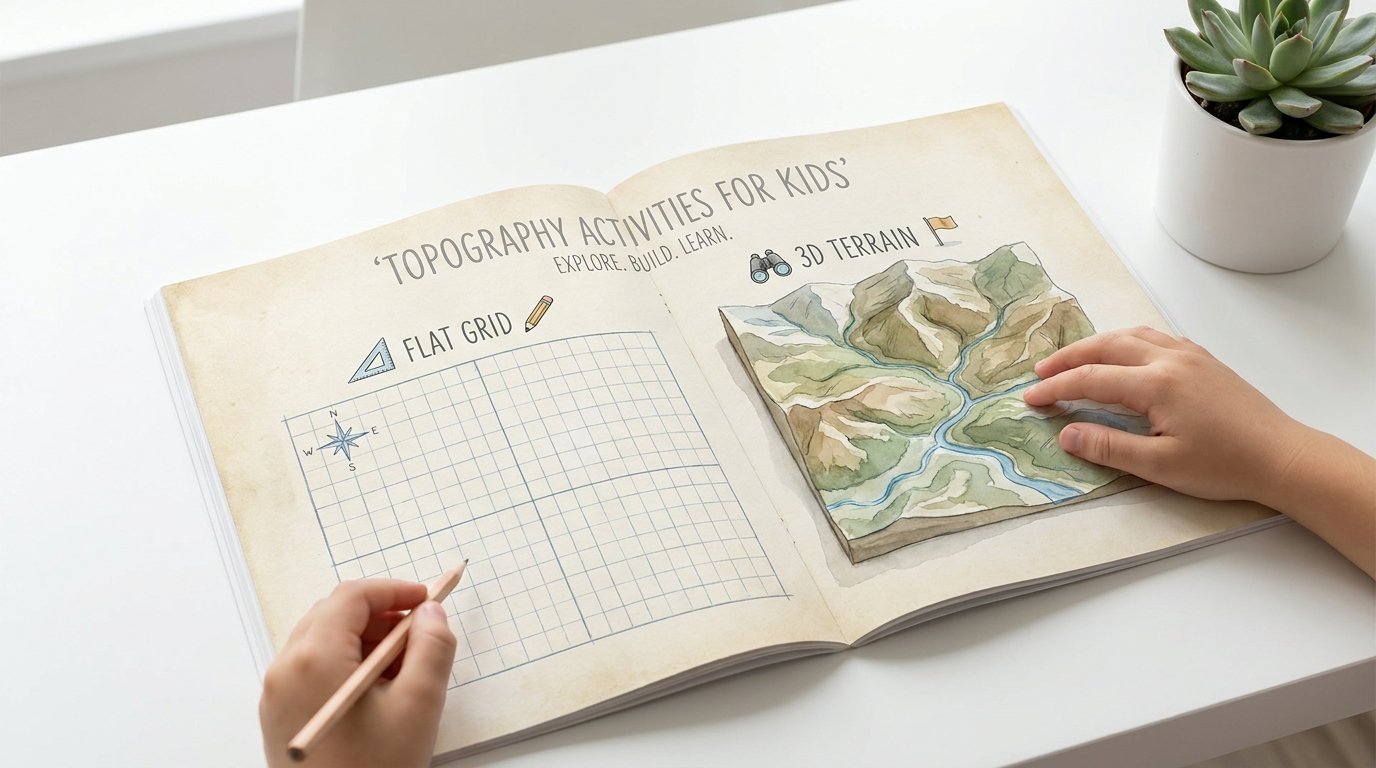
Kids naturally understand 3D space because they live in it. They climb trees, slide down hills, and jump over puddles. Topography activities bridge the gap between their physical play and scientific understanding. It turns the “flat grid” of a textbook into a “3D terrain” they can master with their own hands.
How It Works: The Mechanics of Mapping
Mapping in 3D involves translating elevation data into physical structures. The most effective way to teach this is through the “slice and trace” method. This process takes a 3D object—like a clay mountain—and breaks it down into 2D information that makes sense. It is the foundation of how modern topographic maps are generated.
Start by creating a simple landform out of modeling clay. This should be a mountain or a hill with a flat base. Ask the child to use a ruler and mark 1-centimeter intervals from the bottom to the top. These marks are your “contour intervals,” representing a set change in height.
Using a piece of dental floss or thin string, slice through the clay at each mark. Keep the slices in order! Take the bottom-most slice and trace its outline onto a piece of paper. This is your first contour line. Place the next slice directly in the center of that outline and trace it. Repeat until the peak is a tiny circle in the middle.
This technique shows exactly why contour lines never cross. You cannot be at two different heights at the exact same horizontal coordinate. As the child traces, they will see that steep slopes result in lines that are very close together. Gentle slopes create lines that are spread far apart. This “aha” moment is the goal of the activity.
For a more advanced version, use clear plastic containers or salad trays. Trace one contour level onto each tray with a permanent marker. When you stack the trays, the 3D mountain “appears” in the air. This transparency helps kids visualize the vertical space between the lines, making the 2D-to-3D transition permanent in their minds.
Building the “Rule of V’s”
One of the most important concepts in topography is how water moves. When contour lines cross a stream or river, they always form a “V” shape. This “V” points upstream, toward the higher ground. Kids can see this in action by carving a small “valley” into their clay model before slicing it.
As they trace the slices, they will notice the indentations. These indentations create the “V” pattern on their paper map. This isn’t just a rule to memorize; it is a physical law. Water flows down the path of least resistance, and the “V” shows exactly where that path is carved into the mountain.
Benefits of 3D Terrain Learning
Tactile learning is the primary benefit here. When a child handles clay, cardboard, or sand, they are using sensory input to build a mental model. This is significantly more effective for long-term retention than looking at a screen or a book. They aren’t just reading about elevation; they are feeling it.
Spatial intelligence receives a massive boost. Mapping requires a child to rotate objects in their mind and understand perspective. They learn to switch between the “bird’s-eye view” (top-down) and the “profile view” (side-on). This skill is essential for future success in STEM fields like engineering, architecture, and geology.
Engagement levels skyrocket during these projects. Studies show that students stay at interactive exhibits, like Augmented Reality (AR) sandboxes, much longer than traditional displays. Dwell time is a key indicator of deep learning. When kids are allowed to “play” with the terrain, they ask better questions and experiment with more complex scenarios.
3D maps are also more intuitive. On a flat map, you have to memorize that brown means mountains and green means plains. On a 3D model, a mountain looks like a mountain. There is no translation layer required. This makes geography accessible to younger children and those with different learning styles who might struggle with abstract symbols.
Challenges and Common Mistakes
Scale is the biggest hurdle for most beginners. Kids often want to make their mountains too tall and their valleys too deep. This is called vertical exaggeration. While it makes the model look exciting, it can make it hard to relate back to a real-world map. Explain that on a real map, the vertical scale and horizontal scale are usually different to make features visible.
Messiness is a practical challenge that parents and teachers must manage. Projects involving papier-mâché, salt dough, or wet clay can get out of hand quickly. Set up a dedicated “splash zone” or move the activity outside. The cleanup shouldn’t be the focus, but it is a reality of hands-on geography.
A frequent error in the “slice and trace” method is losing the orientation of the layers. If a child rotates a clay slice before tracing it, the map will be completely inaccurate. Use a “registration mark”—a vertical line drawn down the side of the clay before slicing—to keep everything aligned. If the marks don’t match up, the map won’t work.
Many kids also struggle with the idea that landforms change. They might think a mountain has always been there and will always look exactly the same. Use these activities to discuss erosion and plate tectonics. Remind them that every time it rains, the “topography” of their backyard changes just a little bit as soil moves from high points to low points.
Limitations of Physical Models
Physical 3D models are time-consuming to create. While they offer deep insight, you cannot quickly “zoom out” to see the whole world like you can with digital tools. They are best used for studying specific landforms—like a single volcano or a local watershed—rather than an entire continent.
Accuracy is another limitation. A handmade clay model will never be as precise as a USGS topographic map. There is inherent human error in slicing, tracing, and measuring. This shouldn’t discourage the activity, but it’s important to frame these as “models” rather than “instruments.” They are tools for understanding concepts, not for navigation.
Environmental constraints can also play a role. If you are teaching in a coastal area, your “terrain” might be relatively flat. It can be hard for kids in the plains to visualize a canyon or a jagged peak. In these cases, you have to rely on imagination and reference photos to guide the sculpting process. The “flatness” of the local environment can sometimes limit the variety of topography they explore.
Comparison: Flat Grid vs. 3D Terrain
Understanding the difference between these two mapping styles helps kids choose the right tool for the job. While the flat grid is standard for navigation, the 3D terrain is superior for conceptualizing physical processes.
| Feature | Flat Grid (2D Map) | 3D Terrain (Physical Model) |
|---|---|---|
| Abstraction Level | High (Symbols and Colors) | Low (Direct Representation) |
| Spatial Reasoning | Requires mental translation | Intuitive and tactile |
| Best Use Case | Navigation and route planning | Understanding drainage and geology |
| Portability | High (Foldable paper or phone) | Low (Bulky and fragile) |
| Complexity | Can be cluttered with data | Focuses on landform shape |
Choosing between these isn’t about which is “better.” It’s about context. A pilot needs a flat grid with precise coordinates. A student needs the 3D terrain to understand why the water always pools in the northwest corner of the playground. Using both together is the “gold standard” for geography education.
Practical Tips for Success
Use household items to keep costs down. You don’t need expensive museum kits. Cardboard from shipping boxes makes excellent contour layers. Old newspapers and flour-water paste create high-quality papier-mâché mountains. Even a pile of dirt in the garden can be a topographic laboratory with the right guidance.
Always take a “profile photo” of the model before you slice it. Having a side-view photo allows the child to compare the finished 2D map with the original 3D height. It helps close the loop on the visualization process. You can even print the photo and have them draw the “elevation profile” directly on top of it.
Integrate digital tools like Google Earth. Find a famous landmark—like the Grand Canyon or Mount Everest—and look at it in the 3D view. Then, look at the 2D “map view” of the same spot. Transitioning between the screen and the physical model helps kids realize that the “layers” they made in clay exist in the real world on a massive scale.
- Keep the contour interval consistent: If you use 1cm for the first slice, use it for all of them.
- Use color coding: Paint the lowest layers blue (water), middle layers green (plains), and highest layers white (snow caps).
- Mark the peak: Always have the child put a small “X” on the highest point. This helps them understand “spot elevations” on professional maps.
- Drainage test: Once a model is finished (and dry!), pour a small amount of water on the peak to see where the “rivers” form.
Advanced Considerations for Serious Learners
For older kids or those with a deep interest, introducing Geographic Information Systems (GIS) is the logical next step. GIS is the software professionals use to manage topographic data. Free tools like QGIS allow students to download real elevation data from their own zip code and generate digital contour maps.
The “Rule of V’s” can be expanded into the study of watersheds. A watershed is an area of land where all the water under it or draining off it goes to the same place. By building a larger 3D model with multiple peaks and valleys, kids can map out “drainage divides”—the high ridges that separate one watershed from another.
Consider the role of technology like the AR Sandbox. This setup uses a Microsoft Kinect sensor and a projector to cast real-time contour lines onto a pile of sand. As the child moves the sand, the lines and colors change instantly. This is the ultimate tool for “dynamic topography.” It teaches that the Earth is not static; it is a system that responds to change.
Finally, discuss the math of “gradient.” Gradient is the measure of how steep a slope is. It is calculated as “rise over run”—the change in elevation divided by the horizontal distance. Older kids can use their 3D models and their 2D maps to calculate the gradient of their clay mountain. This brings trigonometry into the real world in a way that makes sense.
Example Scenario: The Backyard Flood Predictor
Imagine a family that has a recurring puddle in the backyard every time it rains. Instead of just complaining, they turn it into a topography project. The child uses stakes and string to create a rough grid over the “trouble spot.” They measure the height from the ground to a level string at various points.
They take these measurements back to the kitchen table and build a small-scale model of the backyard using salt dough. By carefully replicating the “dips” and “rises” they measured, they create a 3D terrain of their own property. They paint the model and mark the area where the puddle usually forms.
Next, they simulate a “flood” by dripping water onto the high points of the model. They observe as the water flows into the exact spot where the real puddle sits. They then use the model to test solutions. “What if we build a small ridge here?” they ask, adding a bit more dough. They see the water diverted. This is practical engineering, powered by a 3D understanding of topography.
Final Thoughts
Topography is more than just a school subject; it is a way of seeing the world. By moving away from flat, abstract drawings and toward tactile, 3D models, we give children a more accurate mental map of the Earth. They learn that every hill has a reason and every valley has a story. They begin to see the hidden patterns that dictate how water flows, where trees grow, and how we build our world.
These activities are easy to start and infinitely scalable. Whether you are using a lemon-sized piece of clay or a high-tech AR sandbox, the goal remains the same: internalizing the flow of the land. Encouraging your child to “think in 3D” prepares them for a lifetime of observation and problem-solving.
The next time you go for a hike or even a walk around the neighborhood, ask your child where the “contour lines” would be. They might just surprise you by pointing out the “slow rise” and the “dip” that everyone else ignores. The world isn’t flat—and now, their understanding isn’t either.
Sources
1 uaf.edu | 2 aroundthekampfire.com | 3 learningundefeated.org | 4 amazonaws.com | 5 instructables.com | 6 topobox.co | 7 evengrounds.com | 8 evengrounds.com | 9 arcgis.com | 10 generationgenius.com | 11 usgs.gov | 12 instructables.com | 13 muttler.net | 14 youtube.com | 15 riverweytrust.org.uk | 16 nih.gov | 17 asu.edu | 18 utk.edu