screen time kids chart
Vague rules lead to constant arguments. Precision leads to peace. Generic ‘no screen’ rules don’t work. You need a precision chart that accounts for different types of digital usage.
If you have ever felt like a broken record saying “five more minutes” for the fiftieth time, you are not alone. Most parents struggle with digital boundaries because they treat all screen time as a single, monolithic activity. But as technology becomes more integrated into our lives, a one-size-fits-all approach to limits is no longer effective.
A precision chart changes the dynamic from a battle of wills to a shared family system. Instead of being the “screen police,” you become a digital mentor. This guide will walk you through creating a screen time kids chart that actually works, balancing developmental needs with the realities of the modern world.
screen time kids chart
A screen time kids chart is a visual management tool designed to categorize digital activities and set clear, predictable boundaries for device usage. Unlike a simple timer, a precision chart recognizes that not all minutes spent on a screen are equal. It provides a framework for parents and children to understand when, why, and how technology should be used.
In real-world terms, this chart acts like a “digital diet.” Just as you wouldn’t let a child eat only candy, you shouldn’t let them only engage in passive, algorithmic scrolling. The chart helps families distinguish between “high-protein” digital activities—like coding a game or video chatting with a grandparent—and “sugar” activities like watching endless toy unboxing videos.

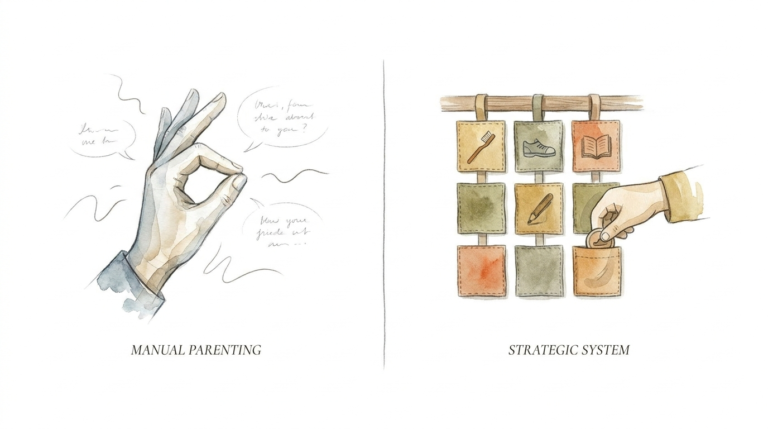
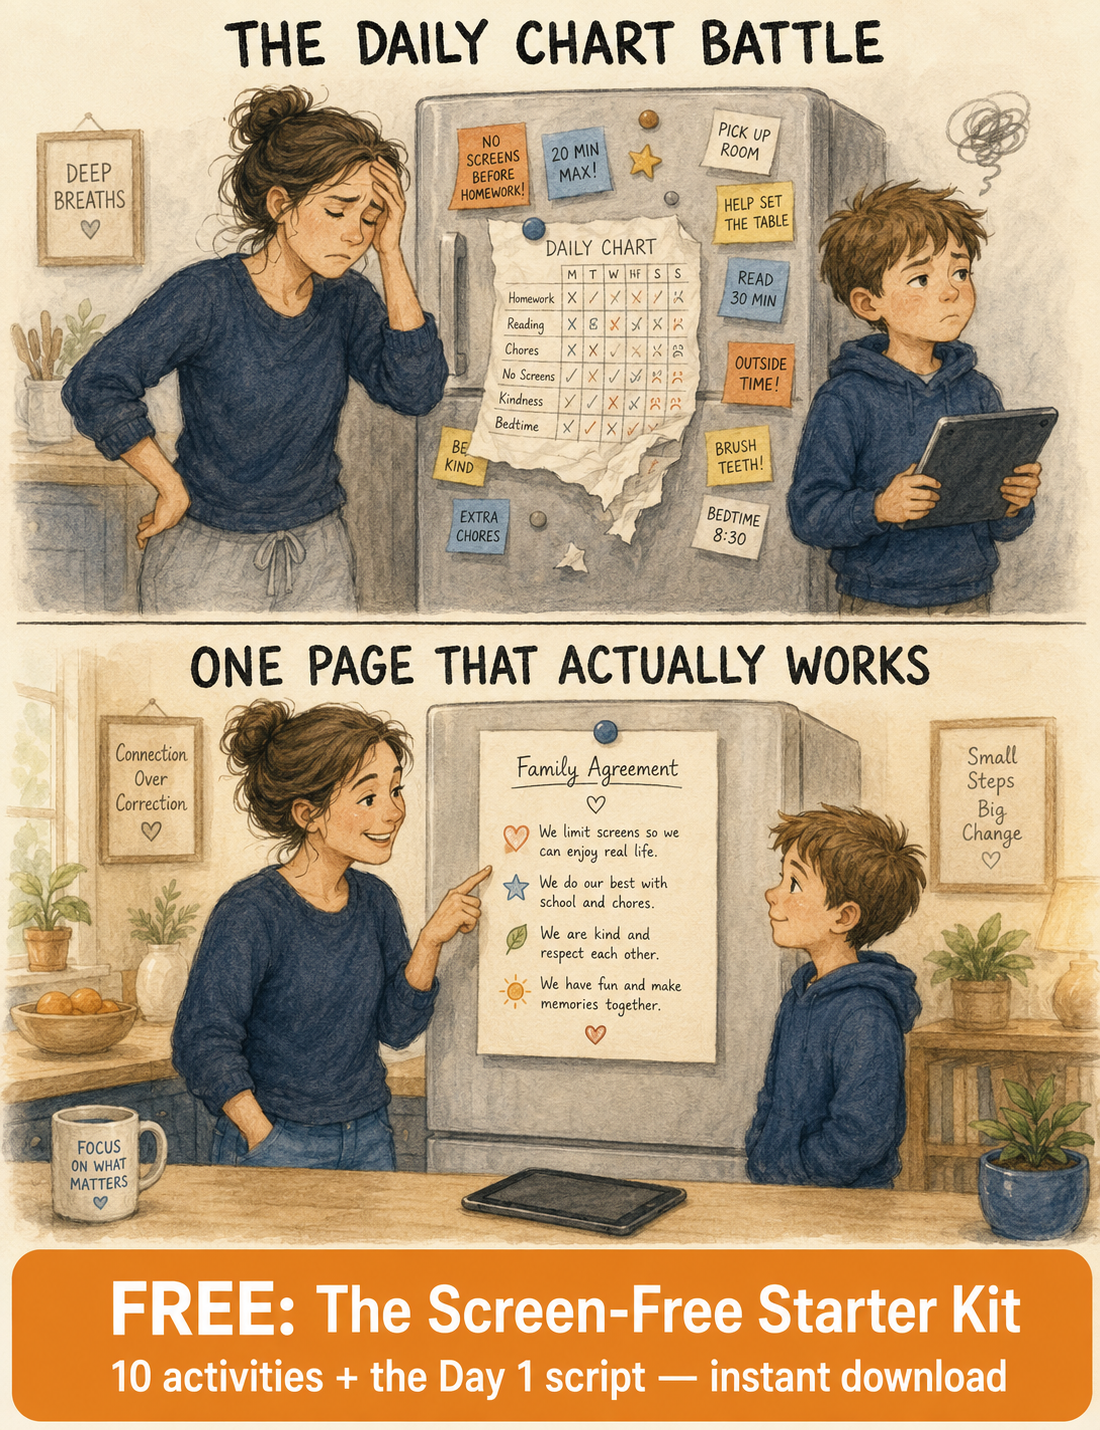
By using a visual chart, you remove the ambiguity that leads to tantrums. When the rules are written down and posted on the refrigerator, the expectations are clear. The chart exists to ensure that screens don’t replace essential human experiences like sleep, physical activity, and face-to-face social interaction.
How to Build a Precision Screen Time System
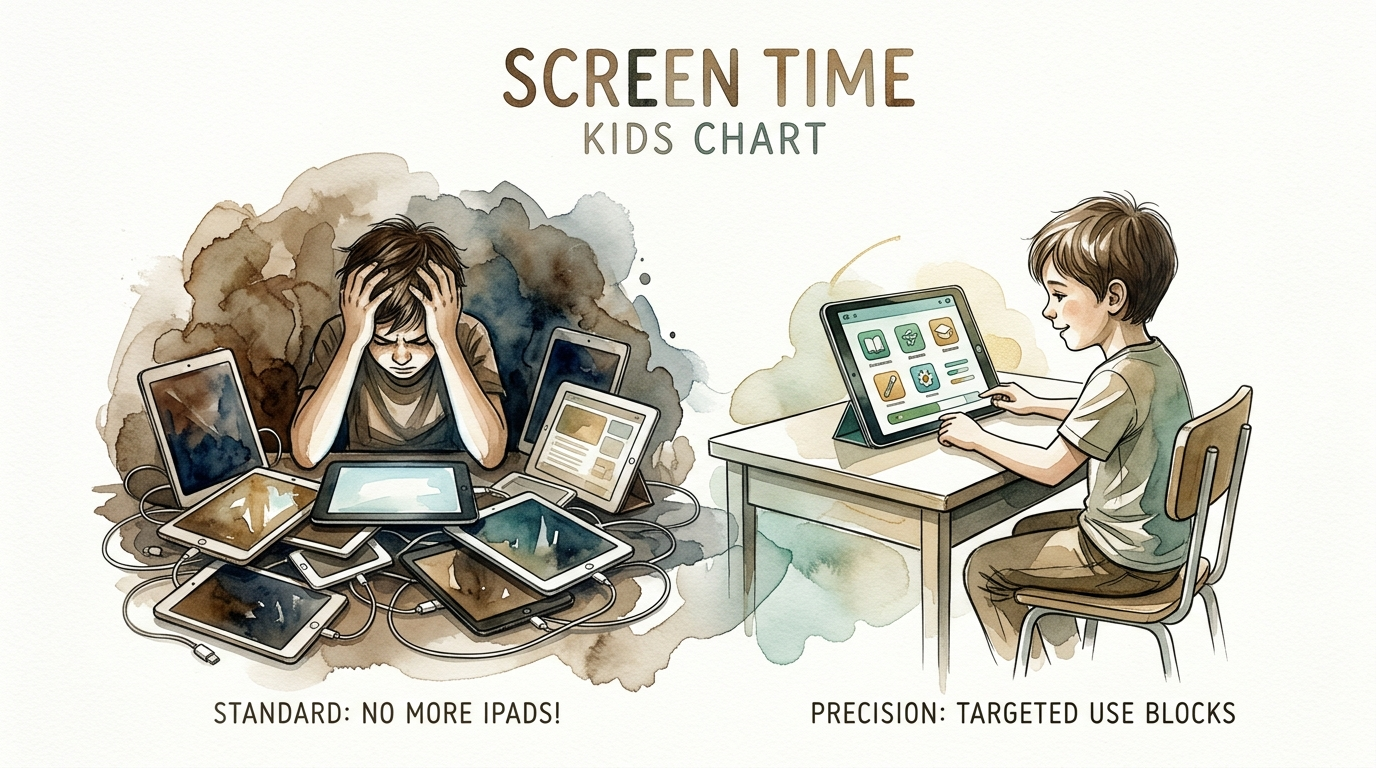
Creating a chart that your kids will actually follow requires a move away from “No More iPads!” and toward “Targeted Use Blocks.” This process involves three main steps: categorization, age-based allocation, and co-creation.
Step 1: Categorize Digital Activities
To make your chart precise, you must first separate screen time into different “value” buckets. This allows you to be flexible with educational use while remaining firm on entertainment.
- Passive Consumption: This includes watching YouTube, scrolling social media, or viewing movies. This is the “candy” of the digital world.
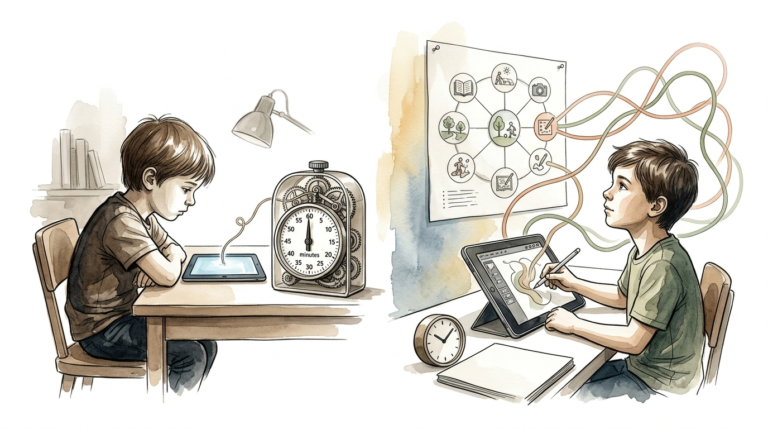
- Active/Creative Use: This includes digital art, music production, coding, or video editing. This should be encouraged more than passive use.
- Social Connection: Video calls with family or playing collaborative games with friends. This is vital for maintaining relationships.
- Educational/Utility: Schoolwork, researching a hobby, or using a fitness app. These are tools, not just toys.
Step 2: Define Age-Appropriate Limits
While the American Academy of Pediatrics (AAP) and World Health Organization (WHO) have moved toward “quality over quantity,” they still provide foundational limits that should anchor your chart.
- Ages 0–18 Months: Zero screen time, except for supervised video chatting with relatives.
- Ages 18–24 Months: Limit to high-quality, educational programming. You should always “co-view” with your child to help them understand what they are seeing.
- Ages 2–5 Years: One hour per day of high-quality, non-violent content. Use this time to bond rather than as a “babysitter.”
- Ages 6 and Older: Focus on balance. Ensure screen time doesn’t interfere with the “Big Three”: 8–10 hours of sleep, 60 minutes of physical activity, and dedicated family time.
Step 3: The “Green Before Screen” Protocol
A common mistake is letting kids jump on devices the moment they wake up. A precision chart should include a “Ready for the Day” checklist. Before any recreational screen time is unlocked, kids should complete their “Green Time” tasks:
- Bed made and room tidy.
- At least 30 minutes of outdoor play or physical activity.
- Reading for 20 minutes.
- Daily chores completed.
Benefits of a Visual Screen Time Chart
Implementing a precision chart offers more than just a quieter house; it builds long-term digital literacy.
Reduces Decision Fatigue: When the chart is the authority, you don’t have to decide every single day how much time is “enough.” The system handles the heavy lifting, which reduces parental stress.
Promotes Executive Function: By following a chart, kids learn to plan their day. They begin to understand that they have a limited “budget” of time and must choose which activities are most important to them.
Encourages “Active” Play: When a chart rewards creative screen use (like learning a new skill on YouTube) differently than passive use (like watching memes), kids are more likely to engage in brain-building digital activities.
Common Mistakes and Pitfalls
Even the best-designed screen time kids chart can fail if it isn’t implemented with consistency.
The “Digital Pacifier” Trap: Using screens to stop a tantrum or quiet a child in a restaurant is tempting, but it prevents them from learning emotional self-regulation. A chart should be a routine, not a reactionary tool to manage bad behavior.
Hypocritical Modeling: If you tell your child “no phones at the table” while checking your email, the chart will lose all credibility. Your own digital habits are the loudest form of instruction.
Sudden Bans Without Context: Taking a device away mid-game can trigger a “fight or flight” response in a child’s brain. Use your chart to establish transition rituals, such as a “five-minute warning” or a physical timer they can see.
Limitations: When the Chart Isn’t Enough
A chart is a tool, not a magic wand. There are situations where strict adherence to a chart may not be ideal.
Sick Days and Travel: During a long flight or a day with a fever, the usual rules often go out the window. It is okay to be flexible in these moments, provided you explain to the child that this is an “exception” and the chart will resume tomorrow.
Neurodivergent Needs: For children with ADHD or autism, digital transitions can be significantly harder. These children may need more visual cues, longer transition times, and a chart that focuses more on “interest-led” learning rather than rigid time blocks.
School Requirements: In the modern classroom, the line between “schoolwork” and “screen time” is blurry. If your child is on a laptop for three hours of homework, you shouldn’t necessarily penalize their recreational time, provided their other health metrics (sleep and exercise) are met.
Practical Comparison: Standard vs. Precision
To understand why a precision chart works, let’s look at the difference between a traditional “No iPads” rule and a targeted system.
| Feature | Standard: “No More iPads!” | Precision: Targeted Use Blocks |
|---|---|---|
| Goal | Pure restriction. | Balanced digital diet. |
| Flexibility | Rigid/Arbitrary. | Context-dependent. |
| Child’s Role | Passive obedience. | Active autonomy/planning. |
| Outcome | Frequent arguments. | Predictable routine. |
Practical Tips and Best Practices
If you are ready to launch your first chart, follow these optimization techniques to ensure success from day one.
- Place it at Eye Level: Post the chart where the child can see it—on the fridge or in the playroom. If they can’t see the rules, they won’t follow them.
- Use Visual Icons: For younger children who can’t read yet, use pictures of a book, a ball, or a tablet to represent different blocks of time.
- The “Transition Ritual”: Instead of shouting “Off now!”, try a “Save Point” ritual. Ask, “Where are you in the game? Do you need two minutes to reach a save point?” This shows respect for their activity.
- Tech-Free Zones: Establish certain areas (bedrooms and dining tables) as 100% tech-free at all times. This is a non-negotiable part of any chart.
Advanced Considerations: The Digital Diet
For serious practitioners of digital wellness, the goal isn’t just to “limit” screens but to “optimize” them. Think of screen time like food groups.
Whole Grains (Learning): Apps like Khan Academy, DuoLingo, or coding platforms. These provide long-term cognitive value. A precision chart might allow “unlimited” use of these during specific hours.
Proteins (Connection): Facetiming with cousins or playing a strategic team game. This builds social-emotional skills.
Sugars (Entertainment): Mindless scrolling on TikTok or YouTube Shorts. This should be the smallest portion of the “diet” and strictly timed.
When you frame the chart this way, you teach your child how to manage their own brain’s dopamine response. You are giving them the tools to survive in an attention economy designed to keep them hooked.
Example Scenario: A Saturday Precision Schedule
To help you visualize how this works, here is a sample “Targeted Use” schedule for an 8-year-old on a typical Saturday:
8:00 AM – 10:00 AM: Analog Morning. Breakfast, reading, and outdoor play. No screens allowed yet.
10:00 AM – 11:00 AM: Creative Block. 60 minutes of “Active” screen time. The child works on a digital drawing or a Minecraft building project.
11:00 AM – 4:00 PM: Green Time. Lunch, family outing, or sports. All devices are charging in a central “Docking Station.”
4:00 PM – 5:00 PM: Social/Passive Block. 60 minutes of YouTube or gaming with friends. This is the “recreational” time.
7:00 PM: All Screens Off. Devices are put away at least 60 minutes before bed to protect sleep quality.
Final Thoughts
Transitioning to a screen time kids chart is a journey, not a one-time event. You will likely face some resistance during the first week as your children adjust to the new “precision” expectations. However, the long-term payoff is a household where technology is a tool for growth rather than a source of conflict.
Remember that the ultimate goal of any chart is to make itself obsolete. As your children grow, the structure of the chart helps them internalize healthy habits. Eventually, they won’t need the paper on the fridge to know that a balanced life requires movement, sleep, and face-to-face connection.
Start simple. Pick three “Green Time” tasks and one “Creative Block” to define this week. Observe how your children respond, adjust the chart together, and watch as the constant arguments transform into a peaceful, digital-literate home.
Sources
1 nurture.is | 2 cacfp.org | 3 hubspotusercontent20.net | 4 bklynlibrary.org | 5 sevendaysvt.com | 6 aacap.org | 7 purpleskycounseling.com