Phenology Wheel For Nature Study
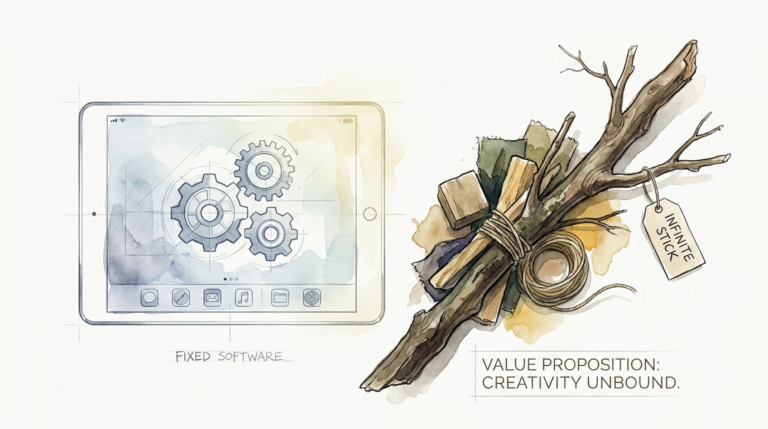
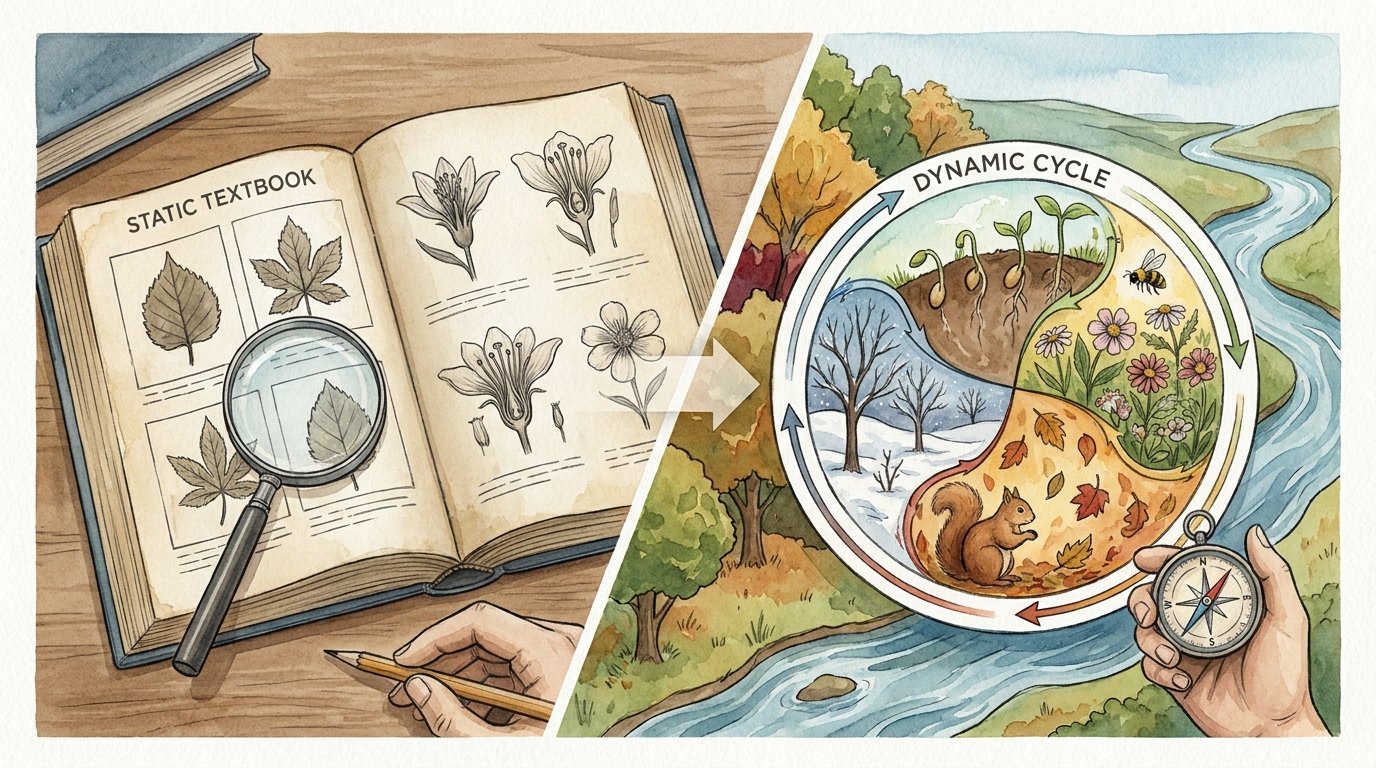
A textbook tells you what a tree looks like; a phenology wheel lets you witness the earth breathing in real-time. Most science curriculum treats nature like a photograph—static, unchanging, and easily forgotten. But nature is a dynamic flow. Through a Phenology Wheel, your child stops looking at ‘a tree’ and starts tracking ‘the tree’ in their own backyard. They see the exact day the first robin arrives and the precise moment the sap begins to run. This is the difference between data and wisdom.

Traditional education often partitions knowledge into dry, isolated facts. You learn the parts of a leaf in one chapter and the migration of birds in another. This approach fails to show how these events dance together in a synchronized rhythm. A phenology wheel acts as a bridge between these scattered facts. It provides a visual, circular map that captures the pulse of the environment over days, months, and seasons.
Every living thing operates on a schedule. From the first swell of a maple bud to the final drop of a golden leaf, these changes are not random. They are responses to sunlight, temperature, and moisture. Tracking these shifts creates a deep, intimate connection with the land. You move beyond being a visitor in nature and become a witness to its ongoing story.
Setting up this practice requires very little equipment. You need a curious eye, a few basic art supplies, and a commitment to observe. The result is a stunning, personalized record of your home place that grows in value every year. It becomes a family heirloom, a scientific record, and a meditative practice all rolled into one beautiful circle.
Phenology Wheel For Nature Study
Phenology is the scientific study of periodic biological phenomena. The term comes from the Greek words phaino, meaning “to appear,” and logos, meaning “study.” Essentially, it is the study of appearances—when does the first flower bloom, when do the frogs begin to sing, and when do the dragonflies emerge? A phenology wheel is the circular journal used to record these arrivals and departures.

The core philosophy of the wheel is the rejection of linear time. Most calendars show time as a series of boxes that we check off and leave behind. Nature does not work in boxes; it works in cycles. Using a circular format emphasizes that every ending is a beginning. When the leaves fall in autumn, the buds for next spring are already set on the branches. The wheel visually honors this continuity.
Scientists use phenology to track the impacts of climate change and environmental health. If the bees emerge before the flowers bloom, the ecosystem faces a “phenological mismatch.” By keeping a wheel, you are practicing the same observation skills used by professional ecologists. You are looking for “phenophases”—specific stages in a life cycle like budburst, flowering, and fruiting.
Historical figures like Aldo Leopold and Henry David Thoreau kept meticulous records of these events. They understood that the arrival of a specific bird species was a reliable indicator of the changing season. Today, this practice is a cornerstone of citizen science. Your personal observations contribute to a larger understanding of how our world is shifting in real-time.
How to Create Your First Phenology Wheel
Designing the layout is the first step in your journey. You can choose to track a single month, a full season, or an entire year on one wheel. For beginners, a monthly wheel is often the most rewarding. It provides enough space to record daily changes without feeling overwhelmed by a twelve-month commitment.
Step 1: Drawing the Framework
Start with a large piece of high-quality watercolor paper. Use a compass to draw three concentric circles. The innermost circle is the “hub,” where you can record the year, the location, or a central theme. The middle ring is your primary workspace for drawings and notes. The outer ring is usually reserved for dates, months, or moon phases.
Step 2: Dividing the Segments
Dividing the circle into equal slices requires a bit of geometry. If you are making a monthly wheel, divide the circle into 28 to 31 sections depending on the month. Use a protractor to ensure the slices are even. Light pencil lines are best, as you may want to paint over them later or erase them once your ink is dry.
Step 3: Choosing Your Focus
Narrowing your focus prevents the project from becoming a chore. You might decide to track only the birds that visit your feeder. Alternatively, you could focus on a “sit spot”—a single tree or a patch of meadow that you visit every day. Some practitioners choose to record physical data like temperature, rainfall, and day length alongside their sketches.
Step 4: Making Daily Observations
Consistency is more important than artistic perfection. Spend five minutes each day looking out the window or walking in the yard. What is different today? Has the color of the grass shifted? Are the shadows longer? Record these small details in your designated slice. Use waterproof ink pens if you plan to add watercolor later.
Benefits of Seasonal Tracking
Observational skills sharpen rapidly when you are looking for specific changes. Most people walk past a forest and see a wall of green. A student of phenology walks past and sees three species of oak at different stages of leaf-out. This “nature literacy” changes how you interact with every landscape you visit.
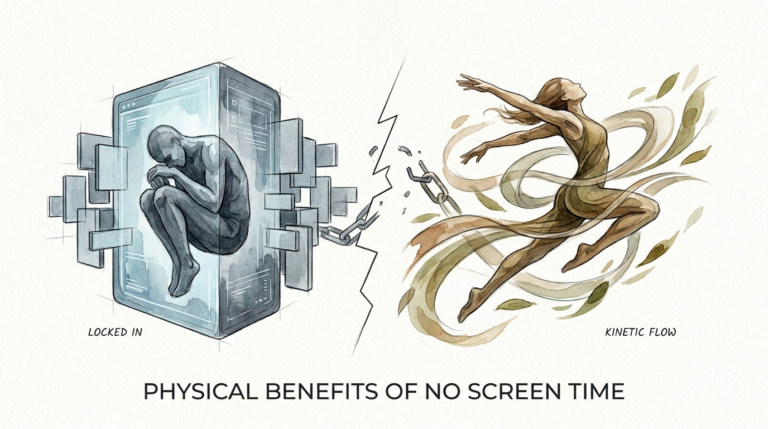
Mental health benefits are a significant part of the practice. The act of slowing down to observe a single plant or bird acts as a form of grounding. It forces a break from the digital world and realigns your internal clock with the pace of the seasons. This reduces stress and fosters a sense of belonging within the local ecosystem.
Scientific literacy grows through direct experience. Instead of reading about “pollination syndromes,” you see the specific bees that visit your squash blossoms. You begin to understand the “first leaf” and “first bloom” indices that researchers use to track spring’s arrival. This turns abstract concepts into tangible, lived reality.
Long-term records provide invaluable data for your specific microclimate. After three or four years of wheels, you can predict exactly when the first frost will hit or when the monarch butterflies will migrate through your yard. You become the expert on your own plot of land, noticing patterns that no generic weather app could ever capture.
Challenges and Common Mistakes
Perfectionism is the primary reason people abandon their wheels. They worry that their drawings aren’t “scientific” enough or that their handwriting is messy. Remember that this is a tool for learning, not a gallery piece. A simple stick figure of a bird with a note about its red wings is more valuable than a beautiful blank page.
Inconsistency often derails the project in the second or third month. Life gets busy, and it is easy to skip a few days. If you miss a week, do not give up. Use a local weather archive or a nature app to fill in the data, or simply leave the space blank. The wheel is a reflection of your life, and sometimes life has gaps.
Overcomplicating the data is another frequent pitfall. Trying to track temperature, moon phases, wind direction, bird sightings, and plant growth all on one wheel can lead to a cluttered, confusing mess. Start with one or two primary indicators. You can always add more complexity once the habit of daily observation is firmly established.
Using the wrong materials can lead to frustration. If you use a pen that isn’t waterproof and then try to add watercolor, your notes will smear into an unreadable gray blob. Invest in archival-quality fineliners and a small set of travel watercolors. These tools make the process much more enjoyable and ensure your record lasts for decades.
Limitations and Practical Constraints
Urban environments present a unique challenge for nature study. You might feel that there is “nothing to see” in a city of concrete and glass. However, urban phenology is a thriving field of study. City trees, pigeons, and even the weeds in sidewalk cracks follow seasonal rhythms. The “urban heat island” effect often causes city plants to bloom weeks earlier than their rural counterparts.
Rapid climate shifts can make your wheel look “wrong” compared to traditional guides. You might see flowers blooming in January or birds staying much later in the fall than they used to. This is not a mistake in your observation; it is a record of a changing world. These anomalies are actually some of the most important data points you can capture.
Indoor living can disconnect you from the nuances of the weather. If you spend all day in a climate-controlled office, you might miss the subtle shift in humidity or the smell of rain on dry soil. To counter this, make it a point to step outside at the same time every day, even if only for sixty seconds. The physical sensation of the air is a vital part of the observation.
Physical mobility or access to wild spaces can be a barrier for some. If you cannot hike into the woods, focus on what is visible from your window. The sky, the clouds, and the way light hits the building across the street are all part of the natural cycle. Phenology is about the “here and now,” regardless of where that “here” happens to be.
Comparing the Wheel to Linear Journals
Deciding which format to use depends on your personal goals and learning style. Both have distinct advantages for the nature student.
| Feature | Phenology Wheel | Linear Nature Journal |
|---|---|---|
| Visual Focus | Cyclical, emphasizing patterns and repeats. | Chronological, emphasizing narrative and detail. |
| Space for Data | Limited; requires concise notes and small sketches. | Extensive; allows for long-form writing and large studies. |
| Ease of Comparison | High; one glance shows the whole month or year. | Moderate; requires flipping through multiple pages. |
| Commitment Level | Daily or weekly routine is essential. | Flexible; can be used sporadically or intensely. |
Choosing a wheel is best if you want to identify long-term trends and “peak” events. The circular layout makes it impossible to ignore the relationship between the sun’s position and the behavior of local wildlife. Linear journals, on the other hand, are better for deep-dive investigations into a specific species or a single afternoon’s hike.
Practical Tips for Success
Keep your supplies in a dedicated spot. If you have to hunt for your compass and pens every time you want to make an entry, you won’t do it. A small basket or drawer near your favorite observation window works best. Include a set of colored pencils or a small watercolor palette to make the process more creative.
Use technology to supplement your observations. Apps like iNaturalist or Seek can help you identify mystery plants and insects. Weather websites can provide the exact high and low temperatures if you forgot to check the thermometer. These tools are excellent for filling in the “hard data” so you can focus your time on sketching and observing behavior.
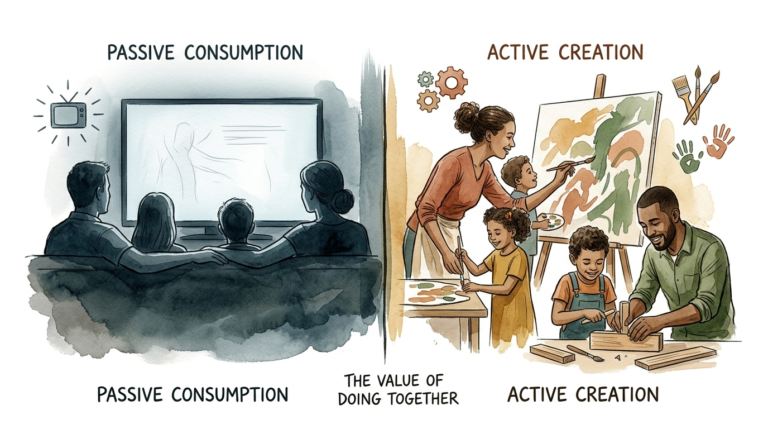
Involve the whole family in the process. Each member can track a different element. One person handles the weather, another looks for birds, and another tracks the garden plants. At the end of the month, you have a comprehensive family record of your shared environment. It turns science into a collaborative art project.
Vary your observation times occasionally. Most of us see the world at the same time every day—usually during the morning commute or after dinner. Stepping out at noon or at dusk will reveal different “phenological windows.” You might see pollinators that only appear in the midday heat or nocturnal animals emerging for the night.
Advanced Considerations for Dedicated Practitioners
Tracking specific “growing degree days” (GDD) adds a layer of scientific depth to your wheel. GDD is a measure of heat accumulation used by farmers and horticulturists to predict when a crop will reach maturity or when a pest will emerge. Recording the cumulative warmth of the season alongside your bloom dates reveals the hidden triggers behind nature’s timing.
Microclimates in your own backyard can lead to surprising variations. The north side of your house might be two weeks behind the south side in terms of spring growth. Advanced practitioners often keep multiple wheels for different parts of their property. This helps you understand how shade, wind protection, and drainage affect the local flora.
Interannual variation is the ultimate reward for the long-term observer. After five years, you can compare five different wheels for the month of May. You might find that the lilacs bloom on a remarkably consistent date, while the arrival of the hummingbirds varies wildly based on the wind patterns. This is where “wisdom” truly begins to manifest.
Participating in national networks elevates your hobby to real-world science. Organizations like the USA National Phenology Network (USA-NPN) or the Woodland Trust’s Nature’s Calendar allow you to submit your data. Your backyard observations help scientists track the “Green Wave” of spring as it moves across entire continents.
Examples and Scenarios
The Backyard Orchard Wheel
Imagine you have three apple trees and a small berry patch. In the center of your wheel, you draw a cross-section of an apple. Each slice of the wheel corresponds to a week in the growing season. You track “silver tip,” “green tip,” “pink bud,” “full bloom,” and “petal fall.” Alongside these stages, you note the first sighting of a honeybee and the date the first codling moth was spotted. By July, your wheel shows a clear correlation between the heat of June and the size of the developing fruit.
The Moon Phase and Tide Wheel
For those living near the coast, the rhythm of the water is the dominant seasonal force. This wheel focuses on the lunar cycle rather than the calendar month. The outer ring tracks the phases of the moon, while the inner ring records the highest and lowest tides. You note the arrival of migratory shorebirds and the spawning of local fish. The wheel becomes a guide for the best fishing times and the most productive days for beachcombing.
The Classroom Community Wheel
In a homeschool or traditional classroom setting, a giant wall-mounted wheel can track the entire school year. Each student is responsible for one “indicator species.” One student watches the resident squirrel, another watches the maple tree near the playground, and another tracks the daily temperature. As the year turns, the wheel fills with a collective history of the students’ shared time outdoors. It builds a sense of “place” and communal responsibility for the local environment.
Final Thoughts
Phenology is more than a branch of science; it is a way of being present in the world. By choosing to track the cycles of nature, you are committing to a lifelong conversation with the land. The wheel provides the structure, but your curiosity provides the life. There is no right or wrong way to start, as long as you start with an open heart and a keen eye.
Everything in nature is connected. The return of the birds depends on the emergence of the insects, which depends on the budding of the trees, which depends on the warming of the soil. A phenology wheel is the only tool that allows you to see all these threads at once. It turns the “background noise” of the outdoors into a clear, beautiful melody that you can finally understand.
Experiment with different styles, colors, and subjects. Let your wheel be a messy, vibrant, and honest reflection of the world outside your door. Over time, you will find that you no longer need the wheel to notice the change in the air or the shift in the bird’s song. You will have internalized the rhythm of the earth itself, moving from a student of nature to a part of its eternal cycle.
Sources
1 youtube.com | 2 usanpn.org | 3 spottyotter.co.uk | 4 earthzine.org | 5 jackbenimblekids.com | 6 nicrn.org | 7 littletruthsstudio.com | 8 lilyandthistle.com | 9 pittsburghbotanicgarden.org | 10 marleypeifer.com | 11 wisc.edu | 12 methodsblog.com | 13 nh.gov | 14 blm.gov | 15 commonthreadsfarm.org | 16 youtube.com | 17 santacruzmuseum.org | 18 ufl.edu